Field note · evaluation
How to Measure AI Correction Burden in a Workflow
Measure AI correction burden beside initial pass rate by recording detection time, correction time, cycles, final quality, and task completion on paired workflow cases.

When teams ask whether an AI workflow improved, initial pass rate is often the only number on the release slide. That number tells you whether the first output passed a check. It does not tell you how much work remained before someone could accept it.
This article gives you a small measurement contract for that missing work. I ran a paired test to make the contract concrete. It uses a local harness, not a frontier model, so the result is an evidence artifact rather than a claim about any vendor.
What should you measure beside an AI benchmark?
Measure initial correctness and recovery as separate stages on the same cases. The compressed brief v2 configuration improved the initial benchmark-like pass rate by 15 percentage points, but increased mean correction burden by 14.20 seconds per case. Among cases with an initial error, median recovery time rose from 54 to 116 seconds.
| Metric | Explicit brief v1 | Compressed brief v2 | Revision minus baseline |
|---|---|---|---|
| Fixed cases | 20 | 20 | 0 |
| Benchmark-like initial pass | 50% | 65% | +15 percentage points |
| First-error rate | 50% | 35% | -15 percentage points |
| Mean detection time, error cases | 19.5s | 38.0s | +18.5s |
| Mean correction time, error cases | 34.8s | 80.14s | +45.34s |
| Median time to detect and correct, error cases | 54s | 116s | +62s |
| Mean correction burden per case | 27.15s | 41.35s | +14.20s |
| Mean correction cycles, error cases | 1.70 | 2.57 | +0.87 |
| Final accepted-output quality, 0-5 | 5.0 | 4.9 | -0.1 |
| Task completion | 100% | 100% | 0 percentage points |
The paired bootstrap 95% interval for the mean recovery difference was -4.35 to 32.45 seconds per case. That interval crosses zero. Treat the result as exploratory. Its value is the diagnosis it makes possible: a better initial score did not guarantee cheaper recovery on the same work.
How do you interpret a higher pass rate with more recovery work?
The revision removed several obvious first errors, but the errors that remained were harder to spot and repair. Compression made the output look more complete while weakening the visibility of context conflicts and missing evidence.
That is the pattern to look for in your own trace:
- The first-pass score rises because required fields are present more often.
- First-error rate falls because obvious omissions disappear.
- The remaining errors move into evidence, policy, ownership, or acceptance details.
- Reviewers need more time to understand the miss before they can correct it.
- More correction cycles erase the apparent efficiency gain.
This is an inference from the paired harness, not a universal law. A different workflow might show the opposite. The important point is to classify the errors, not just count them.
When I teach product managers to move from writing specs to building and shipping, the recurring release question is what “done” means. That observation is qualitative, not a measured result from this test. It matters here because a benchmark needs a concrete accepted state before its score can stand in for useful work.
Why is benchmark score incomplete for workflow measurement?
A benchmark usually asks whether the initial answer satisfies a fixed check. A workflow also asks whether a person can detect the mistake, understand what changed, repair it, and accept the result without starting over.
RealHumanEval is a useful reference because it puts people in the loop and measures task performance rather than only static code answers. Its 243-person study found that benchmark improvements corresponded to higher programmer productivity, but the gaps between benchmark performance and human performance were not proportional (IBM Research). The released project also includes task data, interaction logs, processed study data, and analysis code, which is the right shape for a workflow evaluation artifact (RealHumanEval repository).
The clinical benchmark-correlation study makes the same warning in another domain. It found moderate alignment between medical QA benchmarks and clinical performance, while noting that benchmark results did not capture competencies such as patient communication, longitudinal care, and clinical information extraction (ACL Anthology). The lesson is not that benchmarks are useless. It is that alignment can be partial when the real task includes competencies outside the scored surface.
How should you define the correction clocks?
Define the clock before you run the comparison. Otherwise each team member will report a different version of “correction time.”
| Event | Definition in this test |
|---|---|
| Output submitted | The first version enters the review state |
| First error detected | The harness identifies the first field that differs from the fixed gold fixture |
| Correction started | One second after first-error detection |
| Correction ended | The corrected output satisfies the correction pass and is ready for acceptance |
| Accepted | The corrected output enters the accepted state |
| Time to detect and correct | Correction ended minus output submitted |
This is deliberately narrower than a general task-duration metric. METR estimates task difficulty using the time human experts take to complete self-contained tasks, and it warns that those durations do not equal work done by a high-context professional inside an existing project (METR). METR's long-task paper also links stronger task performance to reliability and the ability to adapt to mistakes, which is close to the recovery question here, while warning about external validity (METR long-task paper).
For a real workflow, keep both clocks:
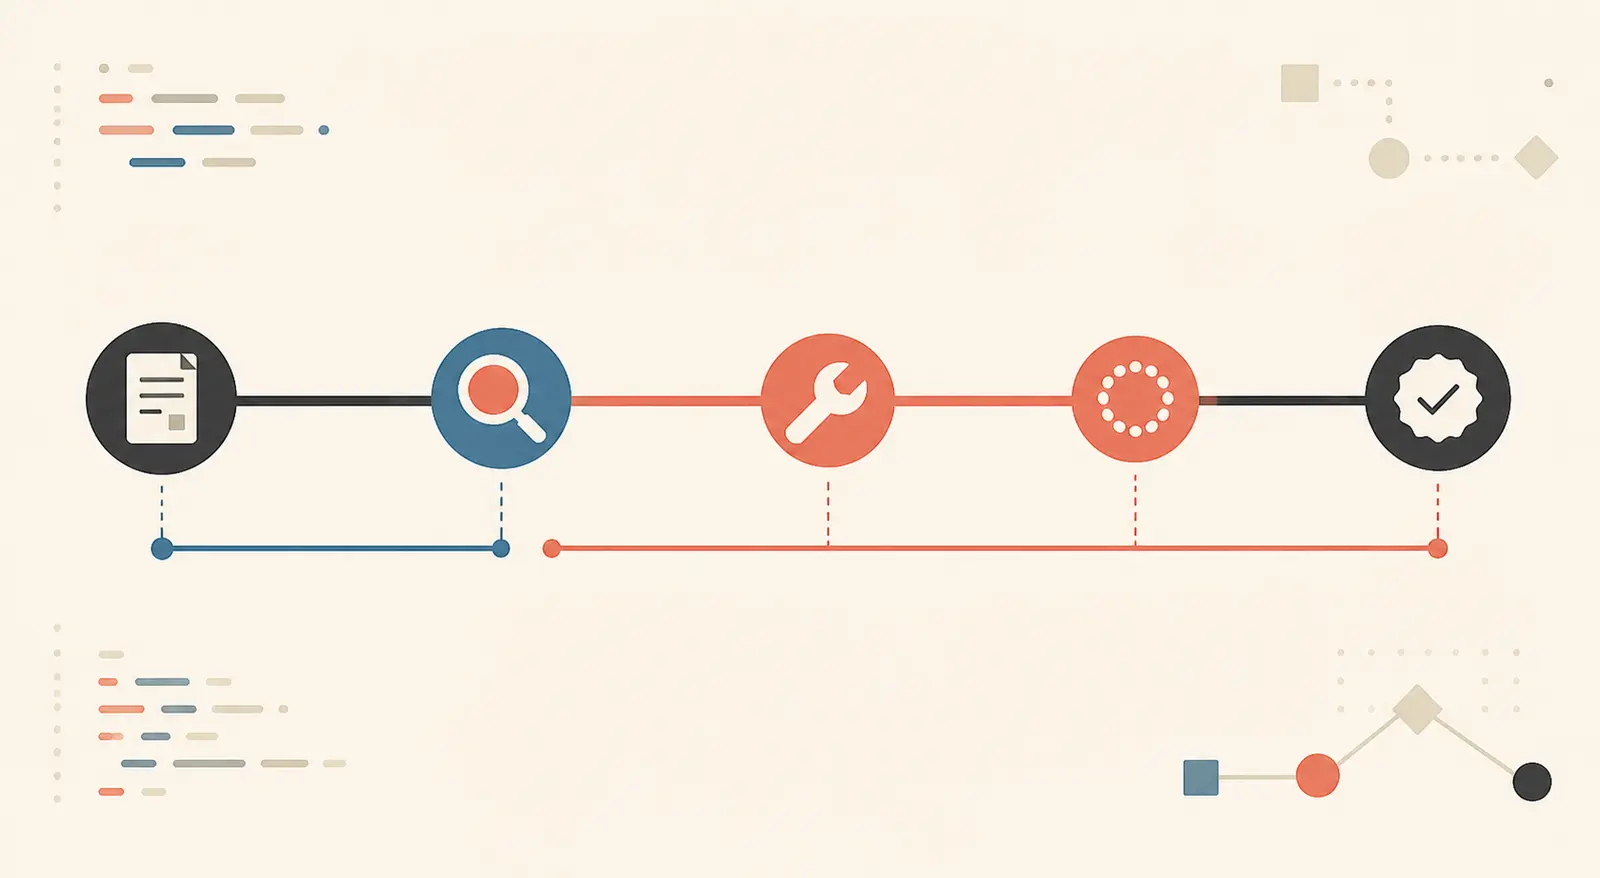
time_to_detect: submission to the first confirmed error;time_to_correct: first confirmed error to accepted output;correction_burden: submission to accepted output for cases requiring correction;correction_cycles: how many edit and recheck loops occurred.
If you only record the last number, you will not know whether the model became harder to inspect or the repair itself became harder.
How should the measurements change a release decision?
Use the benchmark as a gate for initial correctness, then let paired recovery metrics decide whether the workflow improved.
| Observation on the same cases | Release decision | Next check |
|---|---|---|
| Pass rate up, correction burden flat or down, final quality stable | Keep testing the revision | Expand the fixture set with production failures |
| Pass rate up, correction burden up, uncertainty includes zero | Do not declare a regression or a win | Rerun with more paired cases and inspect error types |
| Pass rate up, correction burden clearly up | Hold the release | Make evidence, uncertainty, and acceptance conditions more visible |
| Pass rate up, final quality or task completion down | Block the release | Fix the workflow contract before tuning the benchmark |
| Pass rate flat, correction burden down | Keep the revision under consideration | Check whether the benchmark is insensitive to the useful change |
The threshold in the third row is a decision rule, not a published industry standard. Set the acceptable burden increase with the people who do the review. The rule's non-negotiable part is pairing: compare both configurations on the same cases and preserve the raw event trail.
What should a correction-burden evidence package contain?
Archive the comparison so another person can rerun it without reconstructing your definitions from a chart.
- Fixtures. Store the exact prompts, expected output fields, case categories, and fixture version.
- Configuration. Pin the system version, prompt or transformation rules, tools, permissions, and run date.
- Rubric. Define the benchmark-like checks, first-error rule, correction boundaries, final-quality scale, and task-completion gate.
- Event log. Record raw timestamps for submission, detection, correction start, correction end, and acceptance.
- Analysis. Report paired differences, error-case results, final quality, task completion, and uncertainty.
- Limitations. Say whether the clock is human-observed, instrumented, or simulated, and do not turn a local diagnostic into a model claim.
The companion archive for this test contains fixtures.json, configuration.json, rubric.json, event_log.jsonl, results.json, and run_test.py. If your site or evaluation repository cannot expose these files, include their equivalent in the experiment record and link it from the result page.
For a broader release gate, compare this artifact with how to evaluate an AI agent, and use how to grade an AI output against a rubric when the accepted state is subjective. The parent practice page is AI evaluation practice.
The practical measurement is simple: do not delete the benchmark. Put recovery beside it. If the score rises while correction burden rises too, inspect the paired traces and rerun before calling the workflow better. If you need help turning an existing evaluation into a usable release artifact, Marius Manolachi teaches teams to build AI products on their own work.
Continue with a related field note
- Why AI Benchmarks Improve While Decisions Get Slower
- How to Implement a Counterexample Library for AI Workflow Reviews
- How to Implement a Before-and-After AI Tutoring Transfer Evaluation
- How Much Does a Structured Brief Improve AI Workflow Quality?
- How Much Does Prompt Context Change AI Workflow Cost?
- What Evidence Should Founders Request Before Funding AI?
Questions people ask next
Should I stop using benchmark scores?
No. Keep the benchmark as an initial correctness signal, then pair it with recovery metrics on representative workflow cases. A benchmark is useful when you know which part of the workflow it does not measure.
What is the simplest extra metric to add first?
Add correction burden per case: the elapsed time from output submission to accepted correction, including detection. It exposes a regression that pass rate alone can hide.
How many cases do I need before trusting a correction-time result?
Use a fixed paired set large enough to cover the workflow variants that matter, report uncertainty, and label small runs exploratory. The 20-case result here is a diagnostic, not a population estimate.