Field note · implementation
How to Calibrate AI Confidence Scores for a Workflow
A rerunnable 40-case fixture shows how to map raw AI confidence to observed correctness, fit a post-hoc calibrator, and set review capacity.

When I teach product managers to move from writing specs to building and shipping, the missing piece is often a precise definition of done. Confidence scores have the same problem. A number is not useful until you define what it should mean and check it against outcomes.
I built the small fixture below to make that check concrete. It is a controlled calibration measurement, not a benchmark for a named model.
What does a calibrated confidence score mean?
A calibrated score means that cases receiving a score near 0.70 are correct about 70% of the time, when measured over comparable cases. It does not mean the model feels 70% sure, and it does not guarantee that any single prediction is correct. This definition follows the calibration literature and the reliability-diagram procedure documented by scikit-learn and Guo et al..
The useful unit is the full workflow row:
input -> predicted label -> confidence for that label -> hand-checked outcome
If the workflow extracts an invoice date, correct might mean that the extracted date matches a checked reference. If it routes a request, correct might mean that the route matches the agreed label. Write that event down before you tune a threshold.
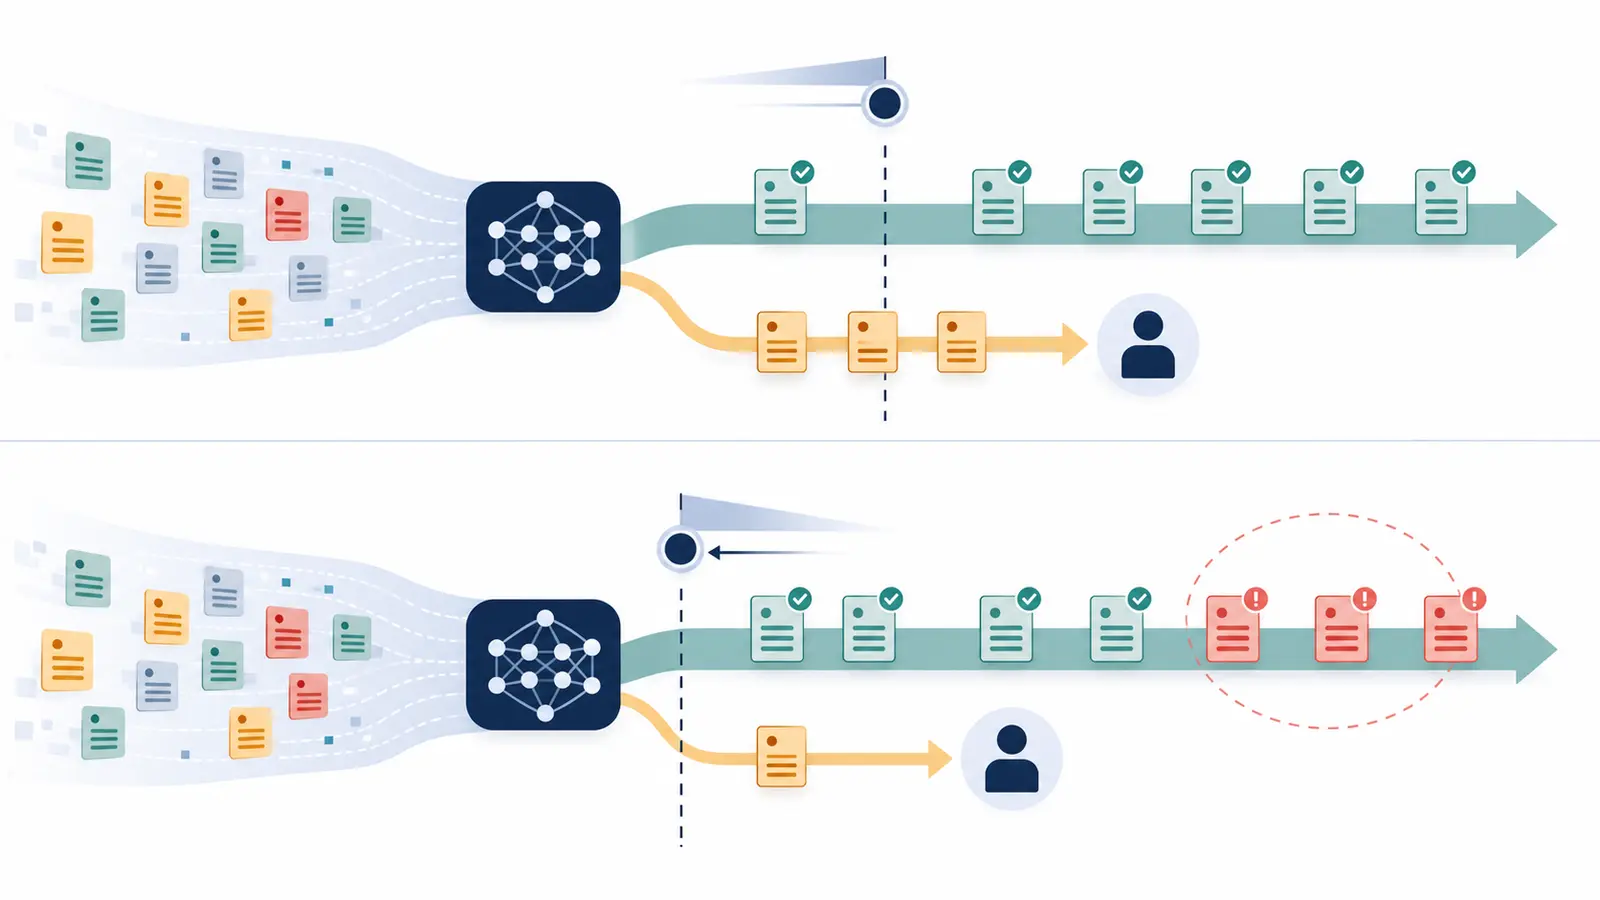
The sourceable result from this page is bounded but practical: in my 40-row fixture, a sigmoid map improved held-out calibration error, yet the same review threshold failed badly on a shifted slice.
| Slice | Cases | Raw ECE | Calibrated ECE | Raw Brier | Calibrated Brier |
|---|---|---|---|---|---|
| Held-out test | 12 | 0.175 | 0.140 | 0.275 | 0.261 |
| Shifted slice | 8 | 0.428 | 0.363 | 0.451 | 0.392 |
ECE is the weighted gap between average confidence and observed accuracy by band. Brier is the mean squared error between confidence and the 0/1 correctness outcome. Both are descriptive here. Neither is a release threshold by itself.
How do you build a calibration fixture?
Use a small, hand-checked fixture with three declared roles: fit the calibrator, test it, and stress it under a changed condition.
- Define correctness. Write the exact expected label or extracted value. Do not use the model's explanation as the gold label.
- Record the signal. Store the raw confidence for the returned label, the model and prompt versions, the input slice, and the final checked outcome.
- Split before fitting. In this fixture, 20 rows are calibration cases, 12 are held-out test cases, and 8 are a shifted slice. Do not fit the map on test outcomes.
- Bin the raw scores. For each band, calculate the number of rows, observed accuracy, and mean confidence. A reliability table makes overconfidence visible.
- Fit one simple map. Start with a sigmoid or temperature-style post-hoc method. Guo et al. found temperature scaling effective in their experiments, while scikit-learn documents sigmoid and isotonic options. The correct method depends on the signal and sample size.
- Choose review capacity before the threshold. Say how many cases a person can review. Then select the lowest calibrated scores until that capacity is reached, and verify the rule on held-out data.
My fixture uses this fitted map:
p_calibrated = sigmoid(0.0902058 + 0.6302669 * logit(p_raw))
Those coefficients belong to this fixture. Copy the method, not the numbers. They are not transferable to your model.
What did the reliability table show?
The raw score was too high in the upper bands. The calibrated score moved closer to observed correctness on the calibration split, and the same direction held on the held-out set.
| Raw confidence band | n | Observed accuracy | Mean raw | Mean calibrated |
|---|---|---|---|---|
| 0.50-0.59 | 3 | 0.667 | 0.550 | 0.554 |
| 0.60-0.69 | 4 | 0.500 | 0.643 | 0.613 |
| 0.70-0.79 | 5 | 0.800 | 0.746 | 0.684 |
| 0.80-0.89 | 4 | 0.750 | 0.850 | 0.766 |
| 0.90-0.99 | 4 | 0.750 | 0.930 | 0.850 |
The top band is the warning. A raw average of 0.93 paired with 0.75 observed accuracy is not a trustworthy 93% probability. Calibration reduces the gap to 0.85, but four rows are still too few to support a strong claim. Scikit-learn's calibration guide makes the same practical point through reliability diagrams: the comparison is between binned predictions and observed outcomes, not between a score and a feeling.
Fit the calibrator on data independent from the base model's training behavior. Otherwise, optimistic training outputs can make the map look more certain than it is, a split rule also documented in the scikit-learn calibration procedure.
How should you choose an abstention threshold?
Choose the threshold from the review queue you can actually staff, then verify the resulting coverage and automatic correctness on held-out cases. Selective prediction research describes this as a risk-coverage trade-off: you cover fewer cases when you reject more, but the covered set may be safer (SelectiveNet).
I set the fixture's review capacity at 25%. On 12 held-out cases, p_calibrated < 0.60 sends exactly 3 cases to review:
| Rule | Reviewed | Automatic coverage | Automatic correctness |
|---|---|---|---|
| Calibrated score below 0.60 goes to review | 3/12 | 75.0% | 6/9 = 66.7% |
That is the correct kind of threshold rationale. “We use 0.80 because it sounds safe” is not.
Review is not a claim that the low-score rows are wrong. One of the three reviewed test rows is correct. The point is to spend human attention on the part of the score range where automatic action is least defensible.
For high-consequence actions, add a hard approval rule even when the score is high. A calibrated number can support routing. It cannot authorize a payment, deletion, or external commitment by itself.
What breaks when the workflow shifts?
The threshold looked acceptable on the held-out slice and failed on the shifted slice. Only one of eight shifted cases fell below 0.60. Seven were sent down the automatic path, and only two were correct, for 2/7 automatic correctness.
The most revealing failures had raw scores of 0.84, 0.88, and 0.96 while still being wrong. After calibration, they remained above 0.60. The map corrected the score scale. It did not learn that these cases belonged to a different operating pattern.
Treat that as a failure-analysis result, not a footnote. NIST's AI RMF measurement guidance calls for documented test sets, metrics, deployment-like conditions, and limits on generalization. A shifted slice is the smallest useful version of that discipline.
Add slices for the changes that matter in your workflow: a new document template, a new language, a new customer segment, a new tool response, a new prompt version, or a new model. Watch calibration by slice rather than trusting one site-wide score.
What should you ship with the calibration rule?
Keep the implementation small and the evidence visible:
- the raw score and calibrated score in the trace;
- the model, prompt, schema, and calibration-set versions;
- the bin counts, observed accuracy, ECE, and Brier score;
- the review capacity and threshold that produced it;
- a held-out set and at least one shifted slice;
- a hard approval path for high-risk actions;
- a rule to quarantine new slices when automatic correctness falls below the workflow's acceptable limit.
Re-run after a model, prompt, schema, label policy, routing action, or input-distribution change. The fixture here used 40 rows and a deterministic harness, so it teaches the method rather than certifying a production threshold.
If this confidence gate is one part of a larger build, connect it to how to scope an AI agent proof of concept, then compare its release checks with how to evaluate an AI agent and the evaluation-dataset workflow. The next useful action is not changing the prompt. It is labeling the next 20 cases and checking whether your current confidence bands deserve to control review.
Continue with a related field note
- How to Make a RAG System Abstain When Evidence Is Insufficient
- How to Define an AI Workflow Result Envelope
- How to Attach Source Evidence to AI Workflow Outputs
- Why Does Valid JSON Still Break My AI Workflow?
- How to Make an AI Workflow Abstain on Ambiguous CRM Identity
- Why Does an AI Extraction Workflow Silently Drop Fields?
Questions people ask next
Can I choose 0.80 as the confidence threshold?
Only if your held-out fixture shows that the calibrated score has the required meaning at 0.80 and your review capacity supports the resulting abstention rate. A round number is not a calibration result.
Should I use sigmoid or isotonic calibration?
Start with sigmoid calibration for a small fixture. Isotonic is more flexible but can overfit when the calibration set is small. Compare both on held-out cases before choosing.
Does calibration detect distribution shift?
No. It remaps a score using past outcomes. Add a shifted slice, monitor reliability by meaningful workflow segment, and use hard review rules for conditions the calibration set does not cover.