Field note · evaluation
Design an Evaluation Sample for Uneven Task Frequency
Use one worksheet to preserve a production-weighted estimate while protecting rare, high-consequence cases from disappearing inside an average.
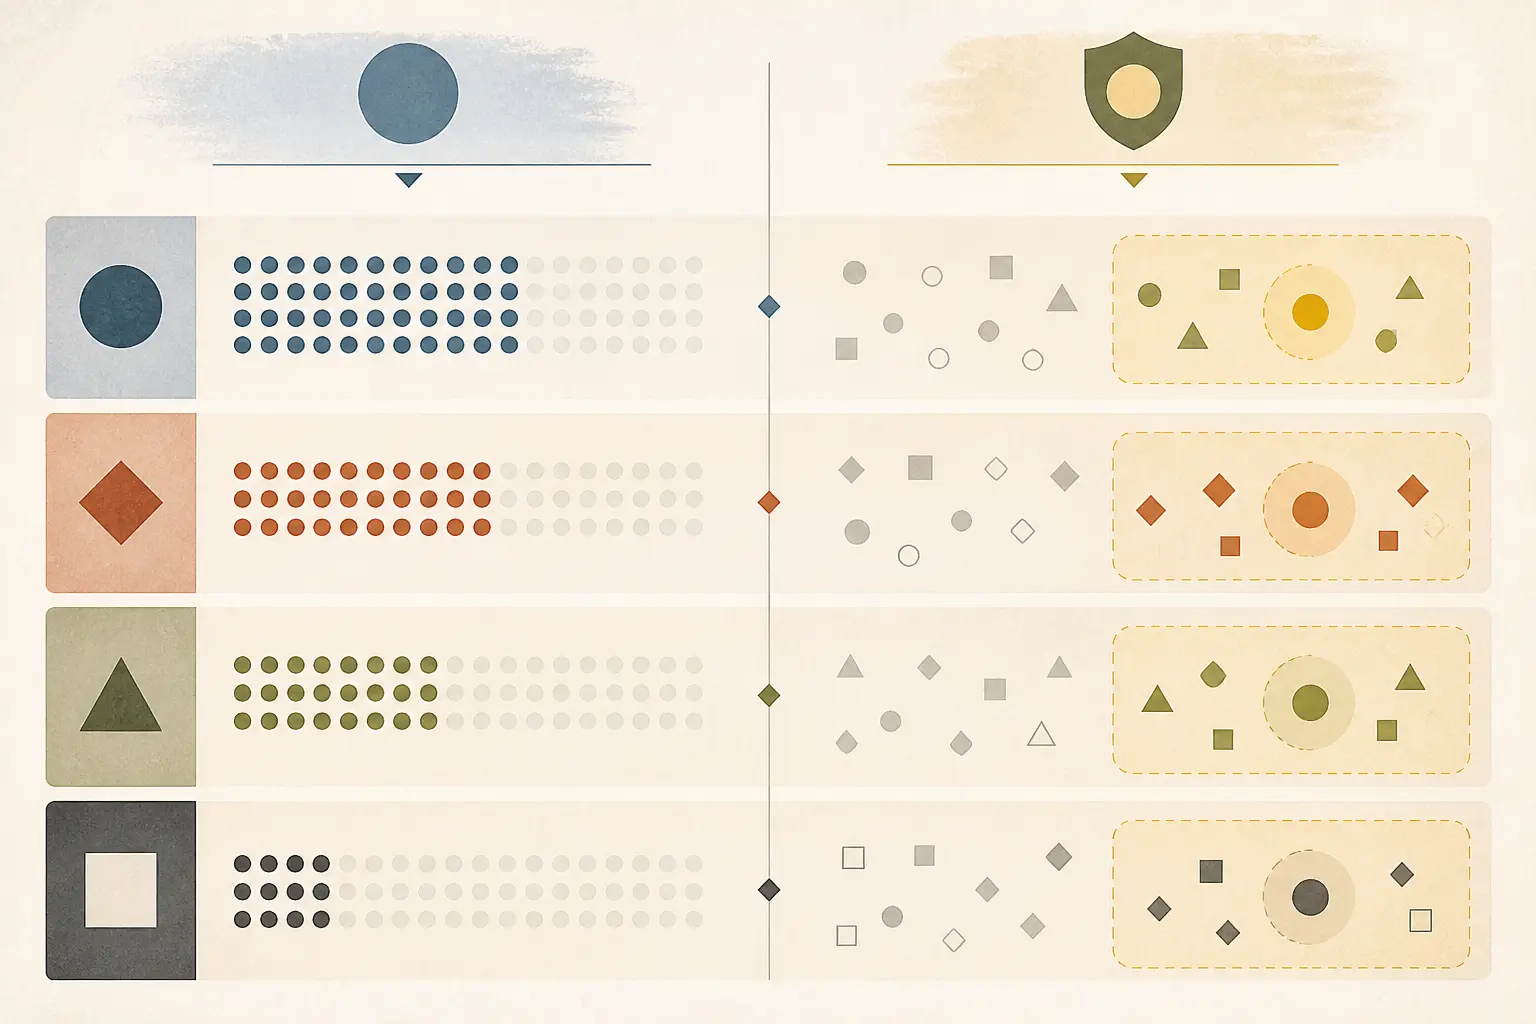
The common cases are easy to sample. They are also the cases most likely to make an evaluation look healthy.
When I taught product managers to move from writing specs to building and shipping, the recurring failure was usually an undefined “done,” not the model. A sample has the same problem when nobody writes down what each row is supposed to prove.

The decision: use two views, not one blended score
Use a prevalence-oriented sample to estimate the workflow’s production mix, then add a protected coverage sample for rare strata whose failures carry more consequence. Report the views under separate names.
Here is the completed synthetic result:
The protected 20-case sample scores 70.0% as a raw coverage average. Applying the stated task frequencies produces a 91.6% production-weighted estimate. The rare high-consequence strata score 50.0%, so the release decision is HOLD.
That contrast is the artifact this page contributes. The 70.0% number is not a production estimate. The 91.6% number is not a guarantee that a deployed workflow will generalize. The rare-case result is not a footnote. It is the reason the illustrative release gate stops.
Start with a stratum worksheet
Define strata before you choose cases or inspect model outcomes. Each stratum should be mutually exclusive, observable from the task record, and connected to a different risk or operating condition.
| Field | What to record |
|---|---|
| Workflow boundary | One bounded AI task and its action or handoff |
| Stratum label | A pre-scoring task condition |
| Frequency p_h | Observed proportion from a named window, or an explicitly synthetic assumption |
| Consequence | Low, medium, high, or critical consequence of a wrong result |
| Minimum coverage c_h | Protected count needed to inspect the stratum |
| Selection method | Random within stratum, systematic, trace-diverse, authored, or synthetic |
| Selected n_h | Cases in the prevalence or coverage arm |
| Result view | prevalence-weighted or coverage-oriented |
| Stratum result | Passed cases divided by selected cases |
| Weight | p_h for the production view, none for the raw coverage score |
| Release rule | Threshold, veto, or investigation condition |
| Provenance | Trace window, dataset version, author, or synthetic label |
This structure fits the way evaluation systems separate data, criteria, and runs. OpenAI’s Evals API defines an evaluation with a data-source schema and testing criteria, then creates runs against a selected data source. That separation is useful here: the worksheet decides what data belongs in each view before a run produces scores. (OpenAI Evals API reference)
Allocation rules
- Normalize the frequency assumptions so
sum(p_h) = 1. - For a prevalence arm with total budget
B, setn_h = round(B * p_h). Give every nonzero stratum at least one case and record rounding changes. - For a protected coverage arm, set
n_h >= c_hfor every stratum, even whenp_his small. - Select within each stratum without replacement from the declared frame. If the frame is synthetic, label it synthetic.
- Preserve the raw coverage result, the production-weighted result, and the rare-case result as separate fields.
NIST makes the distinction behind this design explicit: accuracy on a fixed benchmark is not the same claim as generalized accuracy over potential items similar to the benchmark. A weighted calculation from a small, authored set should be described as a worksheet estimate, not promoted to generalized accuracy. (NIST, “Expanding the AI Evaluation Toolbox with Statistical Models”)
Worked example: an invoice-review workflow
The bounded workflow reads an inbound vendor invoice request and chooses one of three actions: approve, request missing evidence, or escalate to a finance reviewer. The frequencies below are synthetic planning assumptions. They are not observed traffic.
| Stratum | Frequency p_h | Consequence if wrong | Minimum coverage | Prevalence arm, B=50 | Protected arm | Result view |
|---|---|---|---|---|---|---|
| A. Complete routine invoice | 70% | Low to medium, usually reversible through review | 5 | 35 | 5 | Both |
| B. Missing or ambiguous evidence | 20% | Medium, delay or unnecessary escalation | 5 | 10 | 5 | Both |
| C. Duplicate or policy exception | 8% | High, financial loss or policy breach | 5 | 4 | 5 | Both |
| D. Bank-account change or fraud signal | 2% | Critical, wrong approval can be hard to reverse | 5 | 1 | 5 | Both |
| Total | 100% | 20 | 50 | 20 |
The prevalence allocation preserves the task mix. The protected allocation oversamples C and D so five cases appear in each high-consequence cell. Microsoft’s evaluation guidance supports using production traces to represent real behavior, while its trace-sampling guidance emphasizes representative and diverse selection instead of repeated near-identical prompts. That is the logic behind separating the frame from the protected allocation. (Microsoft Foundry cloud evaluation, Microsoft Foundry trace-to-dataset guidance)
Use a labeled manifest, not just a count
The manifest is the audit trail for the decision. Pass means the workflow selected the action allowed by the synthetic case’s expected decision.
| ID | Stratum | Expected action | Outcome | Failure note |
|---|---|---|---|---|
| A-01 | A | Approve | Pass | Correct approval |
| A-02 | A | Approve | Pass | Correct approval |
| A-03 | A | Approve | Pass | Correct approval |
| A-04 | A | Approve | Pass | Correct approval |
| A-05 | A | Approve | Pass | Correct approval |
| B-01 | B | Request evidence | Pass | Correct request |
| B-02 | B | Request evidence | Pass | Correct request |
| B-03 | B | Request evidence | Pass | Correct request |
| B-04 | B | Escalate | Pass | Correct escalation |
| B-05 | B | Request evidence | Fail | Approved without receipt |
| C-01 | C | Escalate | Pass | Correct escalation |
| C-02 | C | Escalate | Pass | Correct escalation |
| C-03 | C | Escalate | Pass | Correct escalation |
| C-04 | C | Escalate | Fail | Approved likely duplicate |
| C-05 | C | Escalate | Fail | Missed policy exception |
| D-01 | D | Escalate | Pass | Correct escalation |
| D-02 | D | Escalate | Pass | Correct escalation |
| D-03 | D | Escalate | Fail | Approved bank change |
| D-04 | D | Escalate | Fail | Approved bank change |
| D-05 | D | Escalate | Fail | Approved fraud signal |
Apple’s evaluation documentation makes the same inspection point operational: aggregate results show overall health, while detailed per-sample results reveal whether failures cluster in one input category. Its dataset guidance also recommends categorizing samples and ensuring each relevant profile has representation. (Apple, “Designing effective evaluations”, Apple, “Designing datasets to test your feature”)
Recompute the production and rare-case views
First calculate the conditional pass rate for each stratum:
| Stratum | Passes | n_h | Pass rate |
|---|---|---|---|
| A | 5 | 5 | 100% |
| B | 4 | 5 | 80% |
| C | 3 | 5 | 60% |
| D | 2 | 5 | 40% |
Now keep the views separate:
| View | Formula | Result | Interpretation |
|---|---|---|---|
| Raw protected coverage | (5 + 4 + 3 + 2) / 20 | 70.0% | Coverage-oriented average, not production performance |
| Production-weighted performance | (0.70*1.00) + (0.20*0.80) + (0.08*0.60) + (0.02*0.40) | 91.6% | Prevalence view under the stated frequency assumptions |
| Rare-case performance | (3 + 2) / (5 + 5) for C and D | 50.0% | Protected result for high and critical strata |
| Critical stratum D | 2 / 5 | 40.0% | Critical failures remain visible |
Spreadsheet formulas:
=SUMPRODUCT(frequency_range, pass_rate_range)
=SUM(rare_pass_range)/SUM(rare_n_range)
The oversampled raw average is 70.0%, while the prevalence recomputation is 91.6%. Neither number is “the score.” They answer different questions.
Apply the release rule before the run
For this worked example, the worksheet uses three predeclared conditions:
- production-weighted performance must be at least 90%;
- rare-case performance across C and D must be at least 80%;
- any critical D failure returns
HOLD, regardless of the aggregate.
The result is HOLD. The weighted view passes its illustrative threshold, but the protected rare-case result is 50%, below 80%, and D contains three critical failures. This is a decision setting for the example, not a universal industry threshold.
Write the veto before scoring. Otherwise the team will be tempted to change the rule after seeing the attractive common-case result. The rare set should also be reviewed case by case, with the expected action and failure note visible to the reviewer.
When the worksheet should use production traces or synthetic cases
Use a named production window when the workflow is live and you can define the task strata from real records. Microsoft describes production traces as representative of real user behavior and treats synthetic generation as complementary for prelaunch scenarios and edge cases. A trace-based sample is still not automatically a fair sample: preserve the time window, workflow version, filters, deduplication, and selection method. (Microsoft Foundry trace-to-dataset guidance)
Use authored or synthetic cases when a critical condition has not appeared in production, when traffic is too low to fill the protected floor, or when you need a stable regression set. Mark those cases clearly. OpenAI’s evaluation model supports versioned data-source definitions and separate runs, which makes it practical to keep the synthetic coverage set and the production trace set distinct. (OpenAI Evals API reference)
Do not let a model-based judge be the only evidence for a high-consequence release decision. Pair the rubric with deterministic checks, an expected action, or domain review. The worksheet is about who is represented and how the result is reported. It does not solve evaluator validity by itself.
For the upstream dataset work, see how to build an evaluation dataset from production traces. For the broader evaluation cluster, use the assigned parent, AI workflow evaluation.
Limits of this decision aid
The manifest is synthetic. The 91.6% figure is a recomputation from declared assumptions, not a production outcome. The 20-case protected set is not a statistical power calculation, and its small denominators can move sharply when one case changes. Frequencies drift as usage, policy, and workflow versions change.
NIST’s fixed-benchmark versus generalized-accuracy distinction is the right warning here. A worksheet can make allocation and reporting auditable. It cannot, by itself, justify a claim about every future task. For a live release, retain the frame, record the time window, inspect per-sample failures, and schedule a refresh when the task mix or model changes.
If you want a second pair of eyes on the worksheet, Marius Manolachi’s AI consulting and tutoring work is designed to make existing teams capable of building and evaluating AI products on their own work. The artifact above remains usable without that next step.
Questions people ask next
Should I weight an oversampled rare-case set?
Yes, if you want a production estimate and you have defensible stratum frequencies. Keep the raw coverage score and the rare-case result separately. Weighting does not erase the reason you oversampled the rare cases.
Can a rare case veto an AI release?
Yes when the consequence is high or critical and the action is hard to reverse. Write the veto before scoring, define the minimum protected count, and record the exact failure rather than hiding it in an aggregate.