Field note · implementation
Why Does AI Fail When Review Becomes a Bottleneck?
A reproducible queueing simulation shows when faster AI drafts create review delay, rework, and escaped errors, plus a routing decision table.

AI can make the first draft faster and the workflow slower. That is the failure people see after a good demo: the model keeps producing work, while the same small group must inspect, correct, explain, and sometimes redo it.
When I taught product managers to move from writing specifications to building and shipping products, the failure was often not the model. It was that nobody could say what done meant. (Marius Manolachi's AI teaching work) In a review workflow, “done” also needs a capacity definition.
This is a qualitative teaching observation, not a measured failure rate. The measured result below comes from the simulator.
Here is the result that matters from the model run in this article:
| High-load path | Mean queue delay | Human utilization | Rework min / 100 tasks | Escaped-error rate |
|---|---|---|---|---|
| Manual | 6370.376 min | 231.7% | 19.947 | 4.03% |
| Always-review | 797.814 min | 116.4% | 8.917 | 1.83% |
| Risk-routed | 0.474 min | 39.0% | 15.242 | 0.92% |
| Screened with LLM judge | 0.237 min | 27.9% | 19.332 | 1.43% |
These are model-based results, not a client outcome. They show why faster generation does not answer the capacity question. If the human queue is the scarce resource, the workflow fails when arrival load plus correction work exceeds the attention available to reviewers.
The bottleneck is human attention, not draft generation
AI fails at this boundary when it reduces draft time without reducing the total human work needed to release a correct result. A queue forms when the rate of work arriving for people is higher than the rate at which people can review and rework it.
The queueing paper Queue & AI: When Faster Tasks Slow Down the Workflow describes this as a gap between mean task speed and system-level delay. Its mechanism fits a common implementation mistake: the team measures how quickly AI produces a draft, but not how much scarce human attention the draft consumes after it arrives.
The useful first check is simple:
base human utilization = arrival rate x mean human service time / reviewer count
That is only a first approximation. Add review routing, error probability, rework time, and service-time variance. A workflow with a 3-minute review can still be slower than expected when errors add 5-minute corrections and service times are uneven.
The exception is a high-cost or irreversible error. If a wrong release, payment, access decision, or customer commitment is expensive to reverse, keep the human boundary even when it limits throughput. Capacity is a reason to throttle or batch the work, not a reason to silently remove necessary control.
What the capacity stress test actually ran
The experiment uses a small discrete-event simulator so you can change the inputs instead of trusting a fixed benchmark. It models two reviewers, a 10,000-minute arrival window, 20 replications per cell, and lognormal human service times with a coefficient of variation of 0.8.
| Input | Configuration |
|---|---|
| Reviewers | 2 |
| Arrival rates | 0.20, 0.50, 0.75 tasks/minute |
| Manual completion time | 6.0 min |
| AI draft time | 0.8 min |
| Human review time | 3.0 min |
| Rework time | 5.0 min |
| AI draft error probability | 12% |
| Manual error probability | 4% |
| Review catch rate | 85% |
| Service-time coefficient of variation | 0.8 |
The four paths are:
- Manual: every task receives 6 minutes of human work. A 4% error probability creates rework.
- Always-review: every AI draft receives human review. Review catches 85% of draft errors.
- Risk-routed: 30% of tasks are high-risk and reviewed; 70% bypass review with a lower modeled error probability.
- Screened with an LLM judge: a non-human judge screens every draft. Flagged items reach a reviewer. The judge has 80% sensitivity and a 10% false-positive rate.
The simulator records mean queue delay, human utilization, rework minutes per 100 tasks, escaped first-pass errors, and mean end-to-end cycle time. The raw output is stored in raw-results.csv; the summarized output is summary-results.csv. Reproduce it with:
python3 simulator.py \
  --config config-v1.json \
  --raw-out raw-results.csv \
  --summary-out summary-results.csv
The human service-time draw uses a lognormal distribution:
sigma^2 = ln(1 + CV^2)
mu = ln(mean) - 0.5 x sigma^2
Queue delay is the mean time from a human job becoming ready to a reviewer starting it. Human utilization is busy human minutes divided by the two-reviewer capacity during the arrival window. Rework load is rework minutes per 100 original tasks. Escaped-error rate counts first-pass errors that get past the modeled review or bypass it.
The raw stdout from the run was:
version=review-bottleneck-sim-v1
seed=20260824 horizon_minutes=10000 replications=20 reviewers=2 service_time_cv=0.8
load,policy,queue_delay_min,human_utilization,rework_min_per_100,escaped_error_rate,cycle_time_min
low,manual,3.000,0.617,20.437,0.0400,9.301
low,always-review,0.262,0.310,9.008,0.0175,4.165
low,risk-routed,0.026,0.105,15.316,0.0088,1.330
low,screened-with-llm-judge,0.015,0.074,18.231,0.0143,0.975
medium,manual,2703.290,1.557,20.367,0.0401,2818.070
medium,always-review,3.659,0.773,8.919,0.0183,7.627
medium,risk-routed,0.212,0.263,15.145,0.0089,1.379
medium,screened-with-llm-judge,0.101,0.187,19.538,0.0141,1.007
high,manual,6370.376,2.317,19.947,0.0403,6633.249
high,always-review,797.814,1.164,8.917,0.0183,816.255
high,risk-routed,0.474,0.390,15.242,0.0092,1.453
high,screened-with-llm-judge,0.237,0.279,19.332,0.0143,1.040
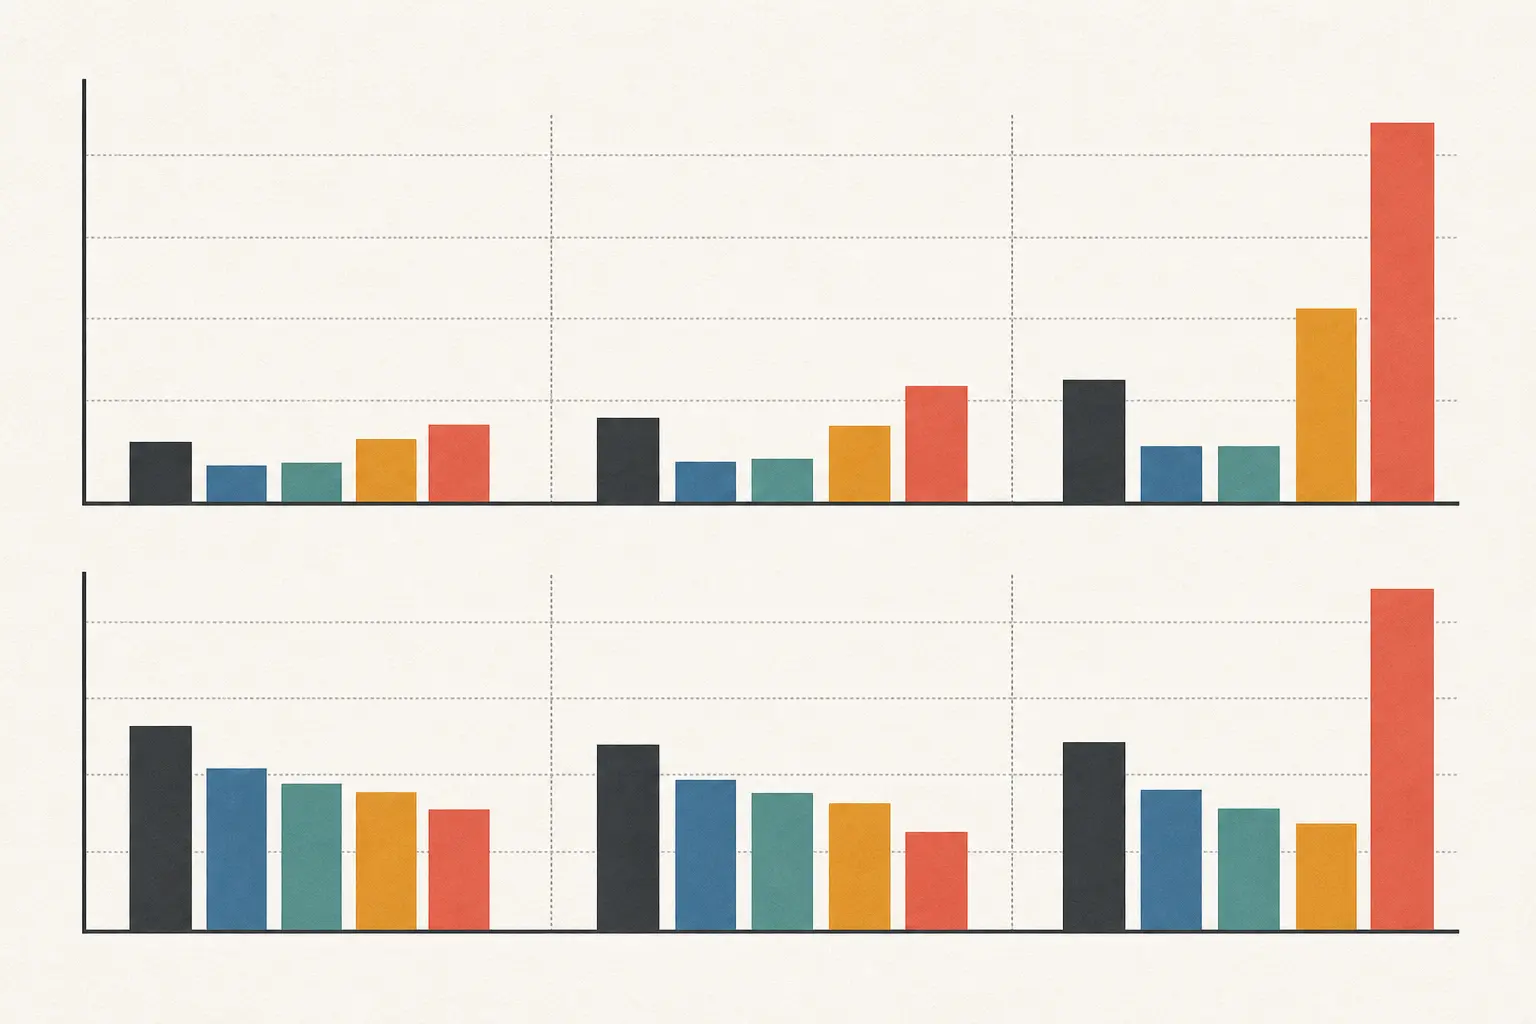
Faster drafts help only while the human queue has room
The full summary shows a regime change, not a universal winner:
| Load | Policy | Queue delay (min) | Human utilization | Rework min / 100 tasks | Escaped-error rate | Cycle time (min) |
|---|---|---|---|---|---|---|
| Low | Manual | 3.000 | 61.7% | 20.437 | 4.00% | 9.301 |
| Low | Always-review | 0.262 | 31.0% | 9.008 | 1.75% | 4.165 |
| Low | Risk-routed | 0.026 | 10.5% | 15.316 | 0.88% | 1.330 |
| Low | Screened judge | 0.015 | 7.4% | 18.231 | 1.43% | 0.975 |
| Medium | Manual | 2703.290 | 155.7% | 20.367 | 4.01% | 2818.070 |
| Medium | Always-review | 3.659 | 77.3% | 8.919 | 1.83% | 7.627 |
| Medium | Risk-routed | 0.212 | 26.3% | 15.145 | 0.89% | 1.379 |
| Medium | Screened judge | 0.101 | 18.7% | 19.538 | 1.41% | 1.007 |
| High | Manual | 6370.376 | 231.7% | 19.947 | 4.03% | 6633.249 |
| High | Always-review | 797.814 | 116.4% | 8.917 | 1.83% | 816.255 |
| High | Risk-routed | 0.474 | 39.0% | 15.242 | 0.92% | 1.453 |
| High | Screened judge | 0.237 | 27.9% | 19.332 | 1.43% | 1.040 |
At low load, always-review buys a lower modeled rework load without using much human capacity. At medium load, it still works in this configuration, but utilization has reached 77.3% and the queue is no longer negligible. At high load, it crosses capacity. The queue delay becomes the result.
Risk routing keeps the queue short in all three regimes because it sends only 30% of tasks to review. It also produces fewer escaped errors than always-review in this model because the reviewed path is concentrated on higher-risk work. That is an assumption about routing quality, not proof that a confidence score will work in your process.
Screening with an LLM judge creates the shortest queue in this run. It also creates more rework than risk routing because false accepts let some errors through and false rejects send correct work into unnecessary review. The second queueing paper, When to Screen, When to Bypass, describes this trade-off directly: screening can amplify human capacity when reviewers are scarce, but can create a rework trap when workers are already stretched.
Use this decision table before you add more review
The table turns observed conditions into an operating choice. The thresholds are starting points for a pilot, not laws. Rerun the model with your measured service and error data.
| Observed condition | Default action | What must be true | Veto |
|---|---|---|---|
| Human utilization below 70%, queue delay stable, rework low | Gate with human review | Review catches the errors that matter and the reviewer can finish within the target SLA | Do not gate every low-risk item if it starves high-risk work |
| Utilization 70% to 90%, queue rising, risk labels have evidence | Risk-route | High-risk recall is measured and low-risk errors are cheap to reverse | Do not trust an uncalibrated confidence score |
| Utilization above 90% for repeated intervals, low-risk work is reversible | Automate or screen the low-risk path | Escaped-error monitoring, rollback, and a human escalation path exist | Do not auto-release irreversible or high-impact decisions |
| Arrival rate is bursty, review is cheaper in groups, backlog is predictable | Batch review | The user can tolerate delay and the batch has a priority and expiry rule | Do not batch time-critical or safety-sensitive work |
| Utilization above 100%, rework is high, or error cost is high | Keep the decision manual and throttle demand | The team accepts lower throughput until capacity or routing evidence improves | Do not call the workflow automated while people still absorb unpriced corrections |
The decision rule is: choose the least human work that keeps escaped-error risk inside the policy limit, then verify that the resulting utilization stays below capacity under the highest normal load. If no path meets both conditions, the right implementation is admission control, more staffed capacity, or no automation yet.
For a broader implementation pattern, start with the queue-backed AI workflow guide. If reviewers work asynchronously, compare the capacity assumptions with the time-zone implementation guide. The assigned parent guide, How to implement AI with review capacity limits, is the place to connect this stress test to a larger rollout plan.
Monitor the workflow after the pilot
Passing a pre-launch evaluation does not prove that a reviewable workflow will remain healthy under changing demand. NIST's AI 800-4 monitoring report distinguishes operational monitoring from human-factors monitoring and notes that controlled pre-deployment evaluations cannot capture all real-world dynamics.
For this failure mode, monitor at least these fields:
| Field | Why it matters | Trigger to investigate |
|---|---|---|
| Arrival rate | Shows whether the queue input changed | Sustained increase above the tested regime |
| Human utilization | Shows whether review capacity is being consumed | Above the team's agreed ceiling |
| Queue delay and backlog age | Shows whether users are waiting | Rising trend or SLA breach |
| Review time | Shows whether task mix or policy changed | Drift from the simulator input |
| Rework minutes | Prices correction work that draft metrics omit | Increase after model or prompt changes |
| Escaped errors and overrides | Tests whether routing protects the right cases | Any high-severity escape or rising override rate |
| Reviewer ownership and incident status | Makes control actionable | No named owner, stale review, or unresolved incident |
The NIST AI RMF Playbook's Govern guidance calls for monitoring frequency, defined roles, periodic review, incident response, and appeal or override processes. For a small team, that can be a short runbook: one owner checks the queue and rework dashboard each day, a second person reviews escaped errors weekly, and a named decision-maker can pause the automated path.
Run the test on your own workflow
Use the artifact before launch or before increasing arrival volume.
- Measure arrivals for a representative window. Keep bursts visible instead of replacing them with one average if the workflow is seasonal or deadline-driven.
- Measure human service time separately for first review, correction, escalation, and final approval.
- Estimate error probability and escaped-error probability from a labeled sample. If you cannot separate them, model a range rather than one confident value.
- Run manual, always-review, risk-routed, and screened paths with the same arrival stream and reviewer capacity.
- Choose a policy only after checking queue delay, utilization, rework, and escaped errors together. Record the policy, thresholds, owner, rollback trigger, and next review date.
Do not replace the simulator with a faster demo. The question is not whether AI can produce a draft. The question is whether the whole system can finish correct work with the people you actually have.
What this simulation cannot tell you
This is a bounded model, not a benchmark of AI systems. It assumes Poisson arrivals, independent errors, homogeneous reviewers, fixed risk-routing accuracy, no priority classes, no reviewer learning, no batching delay, and unlimited draft and judge capacity. It does not model financial loss, customer harm, compliance requirements, or the cost of hiring.
The most important unknown is routing quality. The risk-routed path wins on queue relief because its high-risk fraction and error probabilities are supplied assumptions. A bad router can turn that advantage into silent escapes. The screened path exposes the opposite trade-off: it relieves the queue more aggressively, but false accepts and false rejects add correction work.
Treat the values in the table as a reproducible starting point. Replace the inputs with your own traces, rerun the command, and keep the raw CSV beside the decision record. That is how you find out whether AI is helping the workflow or only moving the bottleneck into a less visible human queue.
Questions people ask next
Should every AI output go through human review?
No. Review every output only when the risk and available capacity justify it. If review utilization approaches capacity, validate a risk-routing or screening policy and keep a human gate for high-cost or irreversible outcomes.
Is an LLM judge a replacement for a human reviewer?
No. An LLM judge changes which items reach the human queue. False accepts can increase escaped errors, while false rejects create rework. Measure both queue relief and correction load before trusting the screen.
What should we measure after adding AI review?
Track arrival rate, human utilization, queue delay, review time, rework minutes, escaped errors, overrides, and incidents. Compare them with a pre-launch baseline and assign a named owner for review and rollback.