Field note · implementation
How Should a PMO Structure an Exception Report for Funding Decisions?
A source-linked audit of 13 reporting designs, with a scorecard and template for turning portfolio exceptions into funding decisions.

Most recurring portfolio reports look complete before anyone asks what decision they are meant to change. The dashboard has numbers. The PMO has a template. The meeting has a calendar slot. The missing part is often the chain from a changed signal to a person with authority to act.
I froze six primary or official sources on 2026-08-24 and coded 13 recurring reporting examples. The result is a comparison artifact, not a universal standard. It shows where the evidence is direct and where the recommendation is my analysis.
The result: use a paired report, not a bigger dashboard
The evidence points to a paired design: a structured quantitative surface for comparable signals, joined to a review interaction that supplies context, dependencies, ownership, and an action threshold. The empirical study found cadence-, tool-, and PMO-driven routines, while GAO and PMI guidance connect reporting to thresholds, periodic review, and resource or alignment decisions. (Stettina and Schoemaker, GAO, PMI)
Here is the worked result from the scorecard later in this post:
| Reporting design | What it contains | Score | Decision |
|---|---|---|---|
| Tool-only dashboard | Automated status and progress, no required context, dependency owner, or action rule | 11/21 | Repair before treating it as governance |
| PMO monthly exception pack | Actual versus expected measures, context, dependency owner, threshold, and investment-board action | 20/21 | Action-ready when the decision window is monthly |
| Two-week cadence review plus quarterly portfolio decision | Working result, metrics, dependencies, context, and a separate strategy and resource forum | 21/21 | Best general starting design in this audit |
The scores are analysis of three worked designs, not measurements of live organizations. The sourceable artifact is the full 13-row table, the visible coding rules, and the copyable review template.
What the evidence actually covers
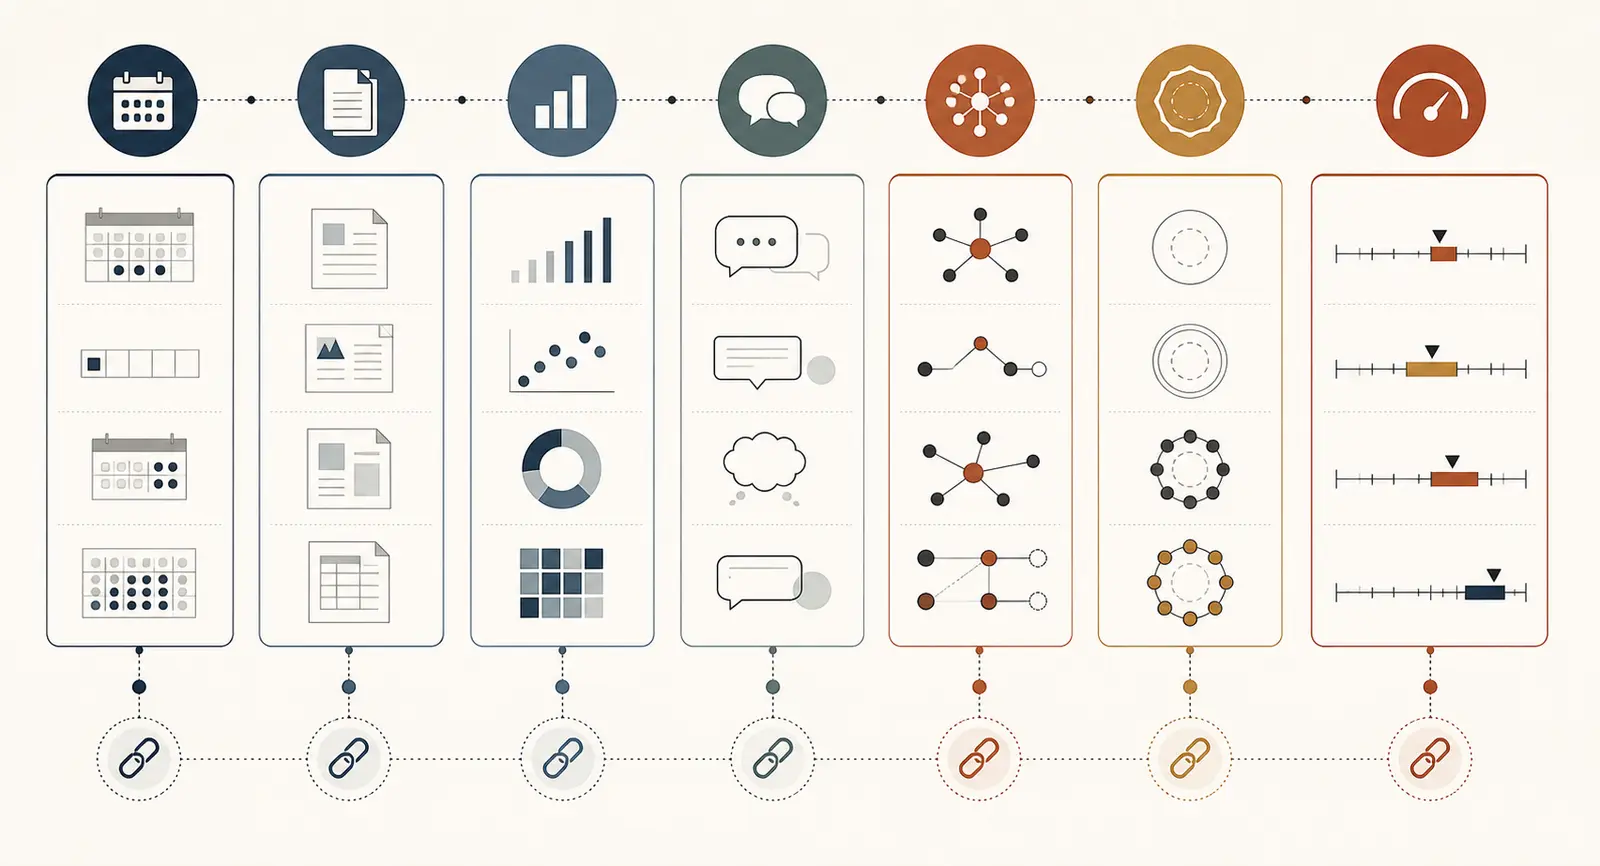
The strongest empirical source is a 2018 conference paper based on 14 interviews in 10 large European organizations using agile portfolio management. It reports three recurring approaches: cadence-driven, tool-driven, and PMO-driven reporting. It also identifies tool-based, document-based, and interaction-based artifacts, plus performance, quality, progress, status, and contextual metrics. (Source S1)
The other sources widen the comparison. The U.S. Government Accountability Office describes project checkpoints, predetermined thresholds, exception reporting, annual or semiannual portfolio review, and a balanced scorecard approach. A primary case report from Group Health Research Institute describes quarterly grant portfolio reviews using six indicators, a SharePoint dashboard, a calendar, a document folder, and an issue tracker. PMI material describes periodic portfolio reporting and review, category-based metric roll-up, stoplight status, and the need to match reporting to stakeholder needs. (GAO, GHRI case report, PMI metrics guidance)
This is enough to compare reporting designs. It is not enough to claim that one cadence always produces better portfolio performance. The sources do not support that stronger claim.
How I built the classification
I used the following method so another reviewer can reproduce the table.
- Freeze the source set and access date.
- Extract only recurring routines or recurring artifacts explicitly described by a source.
- Record the cadence, artifact type, quantitative inputs, qualitative inputs, dependency visibility, ownership, and decision threshold.
- Write
not statedwhen the source does not support a field. Do not convert silence into a negative finding. - Mark each row as empirical, government guidance, standard preview, or official professional guidance.
- Apply the seven-dimension scorecard to a proposed design. Treat the resulting total as a comparison aid, not a probability of success.
The source keys are S1, the empirical agile portfolio study; S2, the GAO framework; S3, the GHRI case report; S4, the PMI standards preview; S5, PMI's metric-category guidance; and S6, PMI's portfolio BI paper.
The 13-row source-linked dataset
The classifications below are my coding of the cited source descriptions. The source did not necessarily use these exact field names.
| ID and recurring example | Cadence | Artifact | Quantitative inputs | Qualitative inputs | Dependencies | Ownership | Decision threshold | Evidence |
|---|---|---|---|---|---|---|---|---|
| R01 Scrum sprint reporting | Biweekly | Tool metrics plus sprint-review interaction | Progress, velocity, status | Working result, stakeholder feedback, next-priority discussion | Partial | Team, Product Owner, portfolio or business stakeholders | Next-priority action, no numeric threshold stated | S1 (https://link.springer.com/chapter/10.1007/978-3-319-91602-6_14) |
| R02 SAFe 4 + 1 reporting | Program Increment cadence | Program Board plus interaction | Progress, timing, resources | Dependency negotiation and reprioritization | Explicit | Product or portfolio, development, and process roles | PI review action, no numeric threshold stated | S1 (https://link.springer.com/chapter/10.1007/978-3-319-91602-6_14) |
| R03 PMO-driven PRINCE2-style report | Monthly in most reported cases | Document or spreadsheet | Cost, schedule, budget, resources, status | Highlights and context | Partial | PMO or PPMO | Gate or Go/Kill action, exact threshold not stated | S1 (https://link.springer.com/chapter/10.1007/978-3-319-91602-6_14) |
| R04 Tool-driven JIRA or CA Agile Central report | Continuous or day-to-day, with high-level or ad hoc review | Tool dashboard or board | Performance, progress, status, quality | Limited context outside the automated surface | Partial | Team and portfolio or product roles | Not stated or ad hoc | S1 (https://link.springer.com/chapter/10.1007/978-3-319-91602-6_14) |
| R05 Working software in sprint review | Each development cycle | Interaction plus working software | Progress through the intermediate result | User feedback and next-priority negotiation | Explicit at the pragmatic boundary | Development team and Product Owner | Feedback changes the next priority | S1 (https://link.springer.com/chapter/10.1007/978-3-319-91602-6_14) |
| R06 SAFe Program Board | PI or portfolio review cadence | Board and synchronous interaction | Timing, resources, work-item status | Negotiated knowledge and dependency context | Explicit | Product or portfolio, development, and process roles | Sequence, resource, or priority action | S1 (https://link.springer.com/chapter/10.1007/978-3-319-91602-6_14) |
| R07 Project checkpoint or gate | Predetermined checkpoints or milestones | Review package or project summary | Cost, schedule, benefits, risk, functionality | Assumptions and affected-group context | Explicit | Investment board or designated working group | Gate; GAO gives more than 10% over expected cost as an example | S2 (https://www.gao.gov/assets/a76793.html) |
| R08 Enterprise portfolio review | Once or twice a year | Portfolio evaluation and resource review | Actual versus expected cost, benefits, schedule, risk | Enterprise alignment and risk interpretation | Explicit | Investment board | Resource-allocation action | S2 (https://www.gao.gov/assets/a76793.html) |
| R09 Exception reporting in portfolio control | Recurring during control reviews | Exception report or performance system | Actual versus expected variance | Mission-critical or organization-specific context | Partial | Investment board or designated third party | Variance trigger leads to remedial action | S2 (https://www.gao.gov/assets/a76793.html) |
| R10 Annual balanced portfolio evaluation | Annual, with regular criteria review | Balanced scorecard plus report | Strategic, customer, internal business, innovation and learning measures | Supporting context and user satisfaction | Partial | Investment board | Strategic alignment and criteria refresh | S2 (https://www.gao.gov/assets/a76793.html) |
| R11 GHRI face-to-face grant review | Quarterly | SharePoint dashboard, calendar, documents, issue tracker, meeting | Six grant indicators, including spend and progress | Team issues, discussion, satisfaction | Explicit | Grants and Contracts Administration, PI, project team | Issue or ranked indicator requires attention | S3 (https://pmc.ncbi.nlm.nih.gov/articles/PMC3788413/) |
| R12 GHRI virtual grant review | Quarterly, virtual option | Emailed materials and links plus tracking system | The same six grant indicators | Less synchronous context, with issues retained | Partial | Grants and Contracts Administration and project team | Issue follow-up | S3 (https://pmc.ncbi.nlm.nih.gov/articles/PMC3788413/) |
| R13 PMI category-based stoplight dashboard | Periodic or continuous | Dashboard, stoplight scorecard, heat map, drill-down | Team-specific measures rolled into categories | Manual explanation when calculation is not reasonable | Drill-down explicit; dependencies not defined | Team lead and governance body | Green, yellow, red status | S5 (https://www.pmi.org/microsites/disciplined-agile/agile/metricaggregation) |
One useful measured detail sits inside R11 and R12. The GHRI case report says its process had completed approximately 25 face-to-face and 5 virtual meetings, with 210 projects and 85 subawards due to be reviewed by the end of 2012. It reports that 22 of 30 people responding to the satisfaction survey liked the face-to-face meetings. Those are results from one case, not a benchmark for your portfolio. (S3)
What pattern appears across the rows
The rows show three practical patterns.
First, cadence is conditional. The empirical study describes biweekly Scrum reporting, Program Increment rhythms, monthly PMO reporting, and tool-driven day-to-day automation. GAO describes checkpoints and a separate enterprise portfolio review once or twice a year. PMI describes periodic reporting and review without prescribing one interval. The interval follows the decision window, not the other way around. (S1, S2, S4)
Second, quantitative data is easier to automate than context. S1 reports automated quantitative information alongside manual qualitative reporting. GAO recommends actual performance against expectations and also allows organization-specific factors. PMI's category guidance lets teams choose different measures while rolling them into common categories and status values. (S1, S2, S5)
Third, a report is more useful when the artifact crosses a boundary. S1 uses the language of boundary objects: repositories can provide shared syntax, standard forms can translate across functions, and working software or a Program Board can support negotiation. The practical translation is analysis: choose the artifact based on what teams must understand or negotiate, not only on what is easiest to export.
The finding I would carry into a review is therefore specific: automate the signal, require the context, record the dependency, name the owner, and state the action before you add another metric. The five-part sentence is my synthesis of the coded rows, not a verbatim source rule.
Use this seven-part scorecard before changing cadence
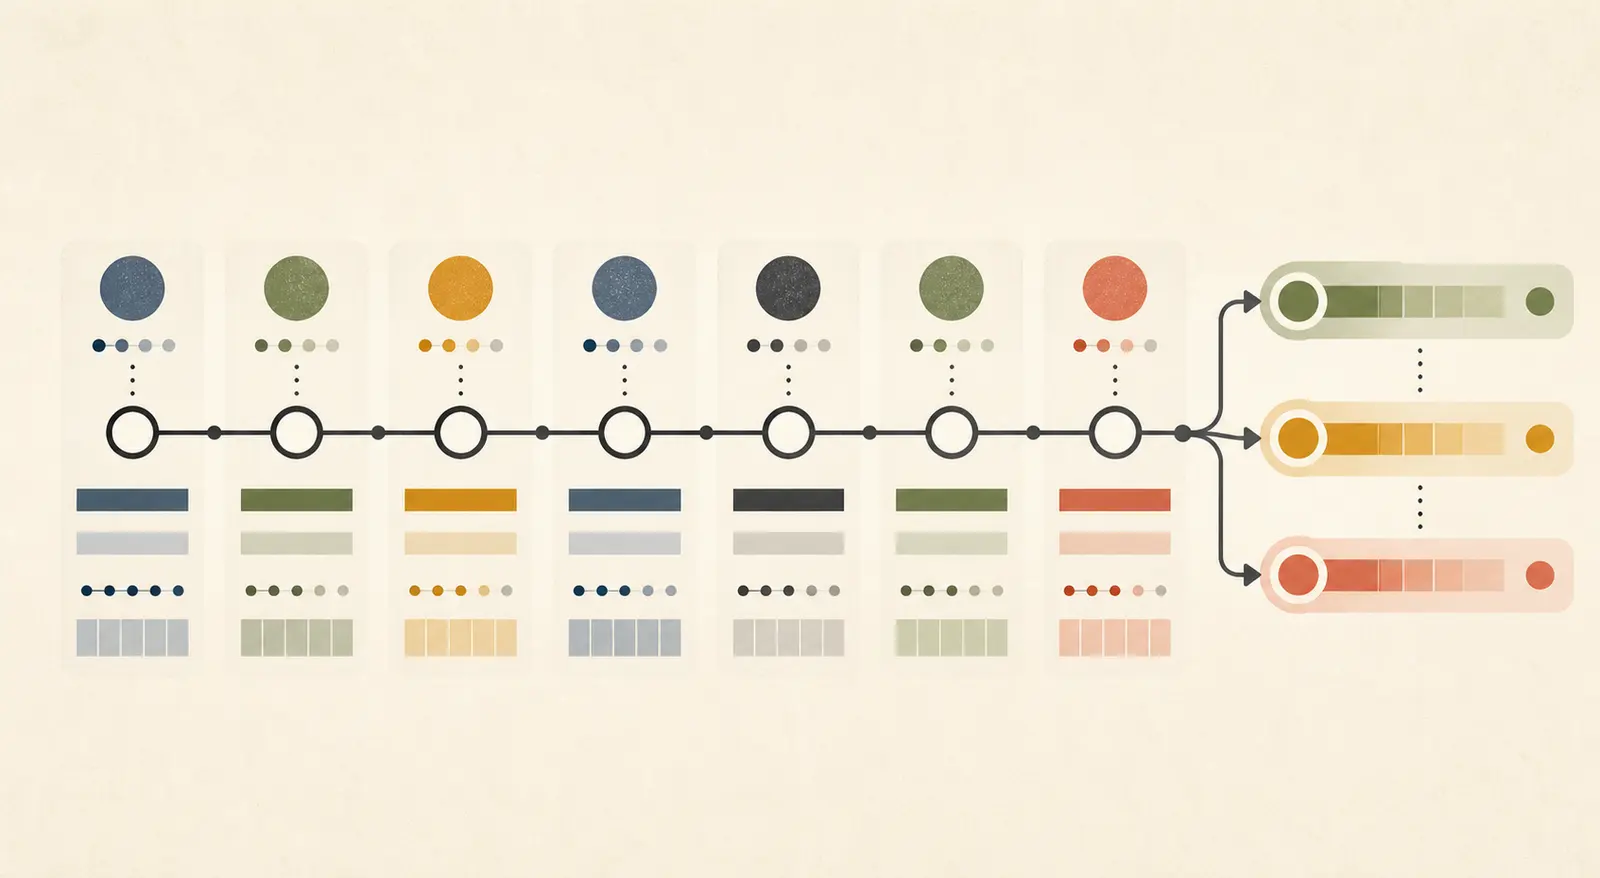
Score each dimension from 0 to 3. The scores test whether the report can move from evidence to action.
| Dimension | 0 | 1 | 2 | 3 |
|---|---|---|---|---|
| Cadence fit | No rhythm | Rhythm does not match decision time | Mostly aligned | Matches the decision window |
| Artifact fit | Raw feed or vague status | Stores information only | Supports review with interpretation | Translates across the relevant boundary |
| Quantitative sufficiency | No comparable measure | Measure without expectation | Trend or variance visible | Variance against a named expectation |
| Qualitative context | None | Unowned free text | Explains an exception | Changes or validates the decision |
| Dependency visibility | Invisible | Memory or conversation only | Some dependencies recorded | Owner, impact, and next action recorded |
| Decision ownership | None | Receiver has no action rights | Owner exists but escalation is slow | Named authority and escalation path |
| Threshold and action | No trigger | Vague trigger | Trigger without clear action | Trigger maps to a decision or remedy |
Use these analysis bands:
- 18 to 21: action-ready, if the data is trusted.
- 13 to 17: reviewable, but repair the weakest dimensions first.
- 0 to 12: status theater risk. The report may inform, but it does not yet create a reliable decision path.
The equal weighting is a deliberate simplification. A regulated or high-risk portfolio may need a heavier weight for traceability or risk. Do not treat 18 as a universal release gate.
Three worked reporting designs
Design A: tool-only dashboard
Use a continuous dashboard with automated progress and status, one red-yellow-green field per team, no required dependency record, no named action owner, and a monthly meeting that reads the dashboard aloud.
| Cadence | Artifact | Quantitative | Qualitative | Dependencies | Owner | Threshold | Total |
|---|---|---|---|---|---|---|---|
| 2 | 2 | 3 | 1 | 1 | 1 | 1 | 11/21 |
The design borrows the quantitative strength of R04 and R13 but removes the interaction, issue follow-up, and threshold-to-action chain present in R07, R09, and R11. Analysis: do not start by adding more tiles. Add a named decision owner, a dependency and impact field, and an action rule for red status.
Design B: PMO monthly exception pack
Use a monthly document built from a common template. Each team submits actual versus expected cost, schedule, benefits, and risk. Every exception includes a short context note, a dependency owner, the decision needed, and the threshold that was crossed. The PMO prepares the pack; the investment board decides.
| Cadence | Artifact | Quantitative | Qualitative | Dependencies | Owner | Threshold | Total |
|---|---|---|---|---|---|---|---|
| 3 | 3 | 3 | 3 | 2 | 3 | 3 | 20/21 |
This design maps closely to GAO's oversight pattern and the PMO evidence in S1. It fits a monthly decision window. The exception is fast-moving delivery. A monthly pack can be too slow for a two-week dependency, so the pack should point to a faster team review rather than pretend to replace it.
Design C: two-week review plus quarterly portfolio decision
Let teams review work at each two-week delivery cycle. The tool supplies progress and quality data. The review records the working result, dependencies, qualitative context, owner, and next action. A quarterly forum compares strategic alignment, category status, and resource trade-offs.
| Cadence | Artifact | Quantitative | Qualitative | Dependencies | Owner | Threshold | Total |
|---|---|---|---|---|---|---|---|
| 3 | 3 | 3 | 3 | 3 | 3 | 3 | 21/21 |
This is a proposed design, not a measured operating result. It combines the cadence and working-software evidence in S1, the periodic alignment logic in S4, category roll-up in S5, and portfolio review logic in S2. It is the best general starting point in this audit when teams deliver at different speeds but leadership still needs a shared strategy and resource decision.
The principal exception is a hard funding or regulatory gate. Keep that gate explicit even when the team review is more frequent.
Copy this review template
Use one row per portfolio component or team. Keep the review artifact short enough that the meeting can spend time on changed signals and decisions.
## Portfolio review: [portfolio] - [date]

Decision this review must enable: [resource, priority, continue, pause, escalate, or accept]
Review cadence and reason: [why this interval matches the decision window]
Source cutoff: [date]
Decision owner: [name and authority]
Escalation path: [role and response window]

<BlogTable data="%7B%22headers%22%3A%5B%22Team%20or%20component%22%2C%22Owner%22%2C%22Quantitative%20signal%20and%20expectation%22%2C%22Qualitative%20context%22%2C%22Dependency%2C%20impact%2C%20and%20dependency%20owner%22%2C%22Threshold%20crossed%3F%22%2C%22Decision%20needed%22%2C%22Next%20action%20and%20due%20date%22%2C%22Evidence%20link%22%5D%2C%22rows%22%3A%5B%5B%22%22%2C%22%22%2C%22%22%2C%22%22%2C%22%22%2C%22%22%2C%22%22%2C%22%22%2C%22%22%5D%5D%7D" />

### Review checks

- Does each changed signal compare actual with an expectation, baseline, or category rule?
- Does each exception have context that could change the decision?
- Are dependencies visible with an owner, impact, and next action?
- Does every threshold map to a decision or remedial action?
- Can the named decision owner act with the authority available in this forum?
- Which field should be removed because it did not change a decision this cycle?
The last check is intentional. A recurring report should earn its fields. If a field never changes a decision, move it to a drill-down or remove it. That is analysis from the scorecard, not a claim that any cited source requires deletion.
What this evidence does not prove
This audit does not prove that biweekly reviews outperform monthly reviews, that dashboards improve portfolio returns, or that every PMO should adopt an exception pack.
S1 is preliminary qualitative research from 14 interviews in 10 large European organizations and names limited cases and early maturity as limitations. S2 is U.S. government IT investment guidance from 2004. S3 is one grant-management case, so its reported meeting satisfaction is not a general effect. S4 is a 2005 preview of PMI standards, not the current standard text. S5 and S6 are professional guidance and proposed methods, not causal evaluations.
Dependency visibility is also under-described in several sources. I coded partial or not stated rather than pretending a dashboard or document was complete. That restraint matters. A blank dependency field is not proof that dependencies were absent.
When I taught product managers who moved from specifications to building, shipping, and automating work, the recurring problem was often that nobody could say what done meant. That is Marius Manolachi's locked F-pms teaching observation, not a measurement of portfolio reporting. It is why the template asks for the decision, owner, threshold, and next action before it asks for more metrics. (Marius Manolachi's AI learning and consulting page)
If you are building the evidence base for one AI or automation opportunity, connect this review to the implementation evidence parent page. For a broader way to compare candidate work before funding a pilot, see how to prioritize AI use cases in a small business. If your team needs a facilitated starting point, the capability-first AI consulting kickoff is the adjacent implementation step.
The next practical move is small: take one recurring portfolio review, fill the template with the last cycle's evidence, score it, and change only the weakest dimension. Add another dashboard only if the score shows that the missing problem is genuinely quantitative.