Field note · evaluation
How to Monitor an AI Agent in Production: An Observability Contract
Monitor production AI agents with a traceable run record, verified outcomes, action and safety signals, privacy controls, and a failure-to-evaluation loop.
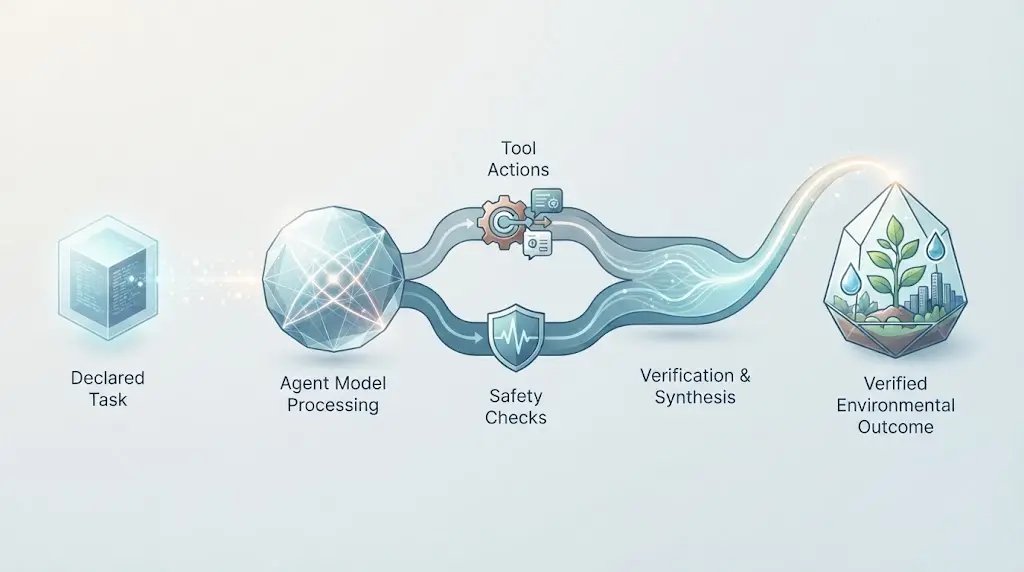
An agent can return a polished answer while the workflow underneath is broken. It may call the wrong tool, retry the same failing action, exceed a budget, or claim success without changing the system of record.
Production monitoring exists to make those failures visible while there is still time to contain them. It is not a larger log file. It is a way to reconstruct a run, check its effect, and decide what happens next.
What does it mean to monitor an AI agent in production?
Monitor the agent as a unit of work, not as a stream of model requests. For every run, you want enough evidence to answer five questions:
- What task was the agent trying to complete?
- Which versioned runtime, tools, permissions, and data did it use?
- What actions, handoffs, approvals, retries, and errors occurred?
- Did it stay within its time, cost, and authority limits?
- What changed in the environment, and was that change acceptable?
That is the difference between “the endpoint returned 200” and “the agent completed the ticket without sending data to an unapproved system.” The second statement is operationally useful because a person can verify it and act on it.
OpenTelemetry's current GenAI work models agent operations with spans for activities such as agent invocation, workflows, planning, and tool execution. The agent conventions are marked Development, so treat their names as a direction for interoperable telemetry rather than a permanent schema (OpenTelemetry agent span conventions).
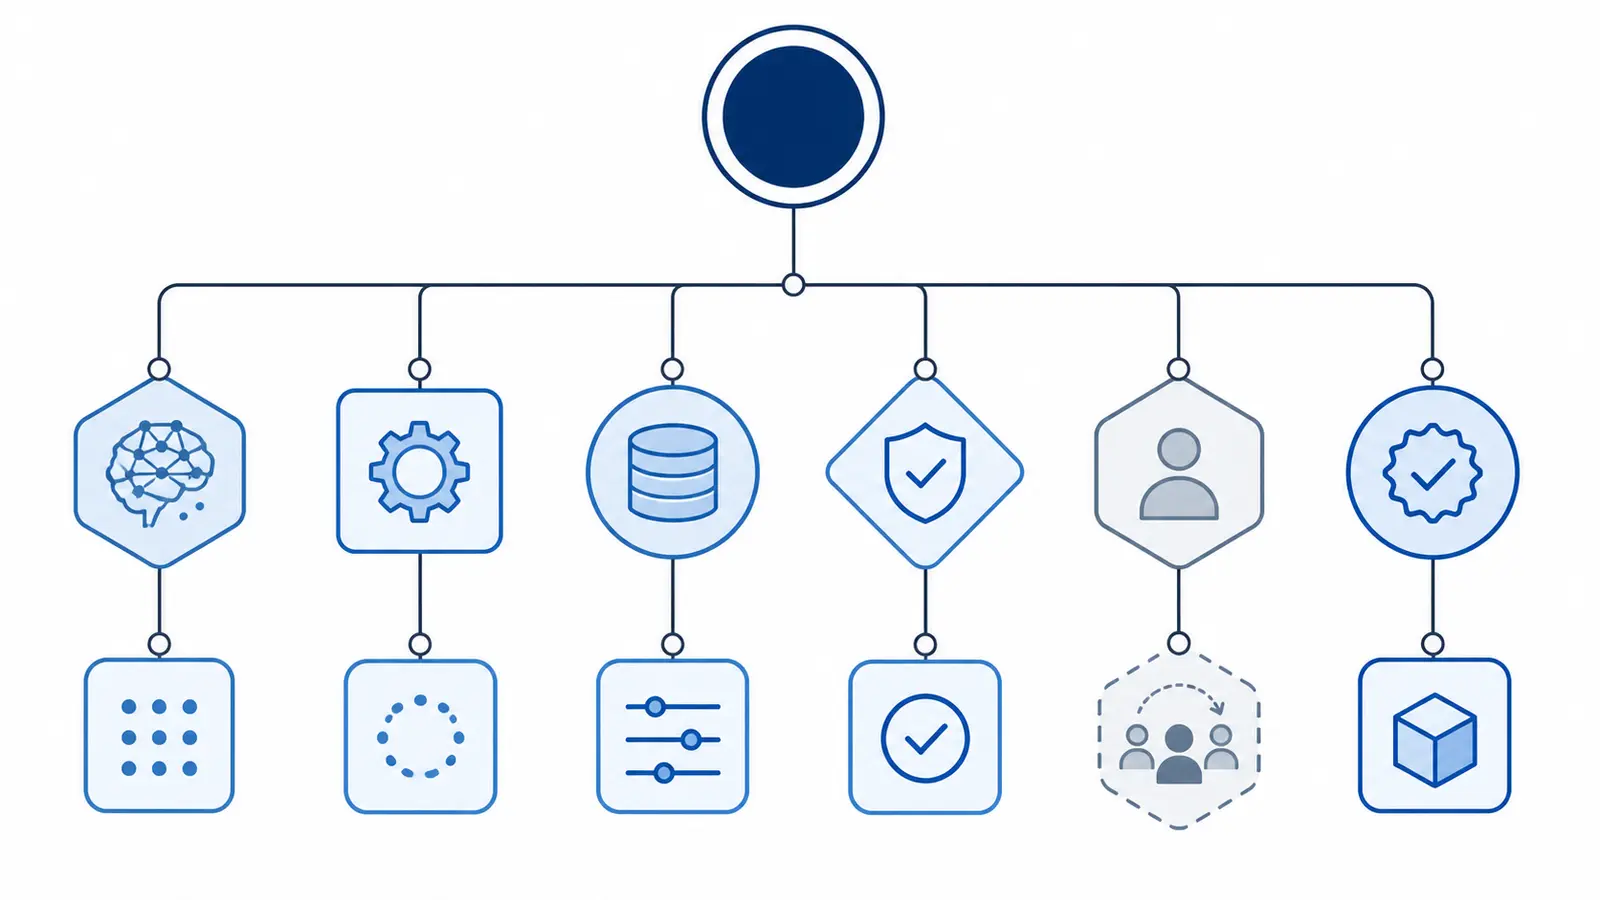
Do not confuse monitoring with evaluation. An evaluation suite asks whether a candidate system behaves acceptably on a known set of cases. Monitoring asks what happened in deployed runs, whether the environment is changing, and whether the system still deserves its current scope. NIST recommends testing before deployment and regularly during operation, including monitoring AI functionality and behavior in production (NIST AI RMF Core). Use the AI agent evaluation release gate for the first question. This article is about the second.
What should one agent run record?
Start with a small contract. I call it TRACE:
| Letter | Record | Why it matters |
|---|---|---|
| T — Task | Declared goal, request ID, user or tenant boundary, and expected outcome | Tells you what “success” means and which data boundary applies |
| R — Runtime | Agent, model, prompt/configuration, tool, environment, and code versions | Makes a behavior change explainable and comparable |
| A — Actions | Model turns, tool calls, normalized arguments, tool results, handoffs, approvals, denials, and errors | Shows what the agent actually did rather than what its final message says |
| C — Constraints | Start/end time, latency, retries, token usage, cost inputs, timeouts, rate limits, and permission decisions | Reveals loops, runaway work, and authority failures |
| E — Effect | Verified state change, final status, escalation, user feedback, and incident or evaluation link | Connects telemetry to the real outcome and the next repair |
TRACE is my organizing framework, not an industry standard or a tested benchmark. Its value is that it forces the outcome and the action trace into the same record. A final answer belongs in the record only when the answer itself is the product. If the agent is changing a ticket, file, database row, or payment state, verify that effect directly.
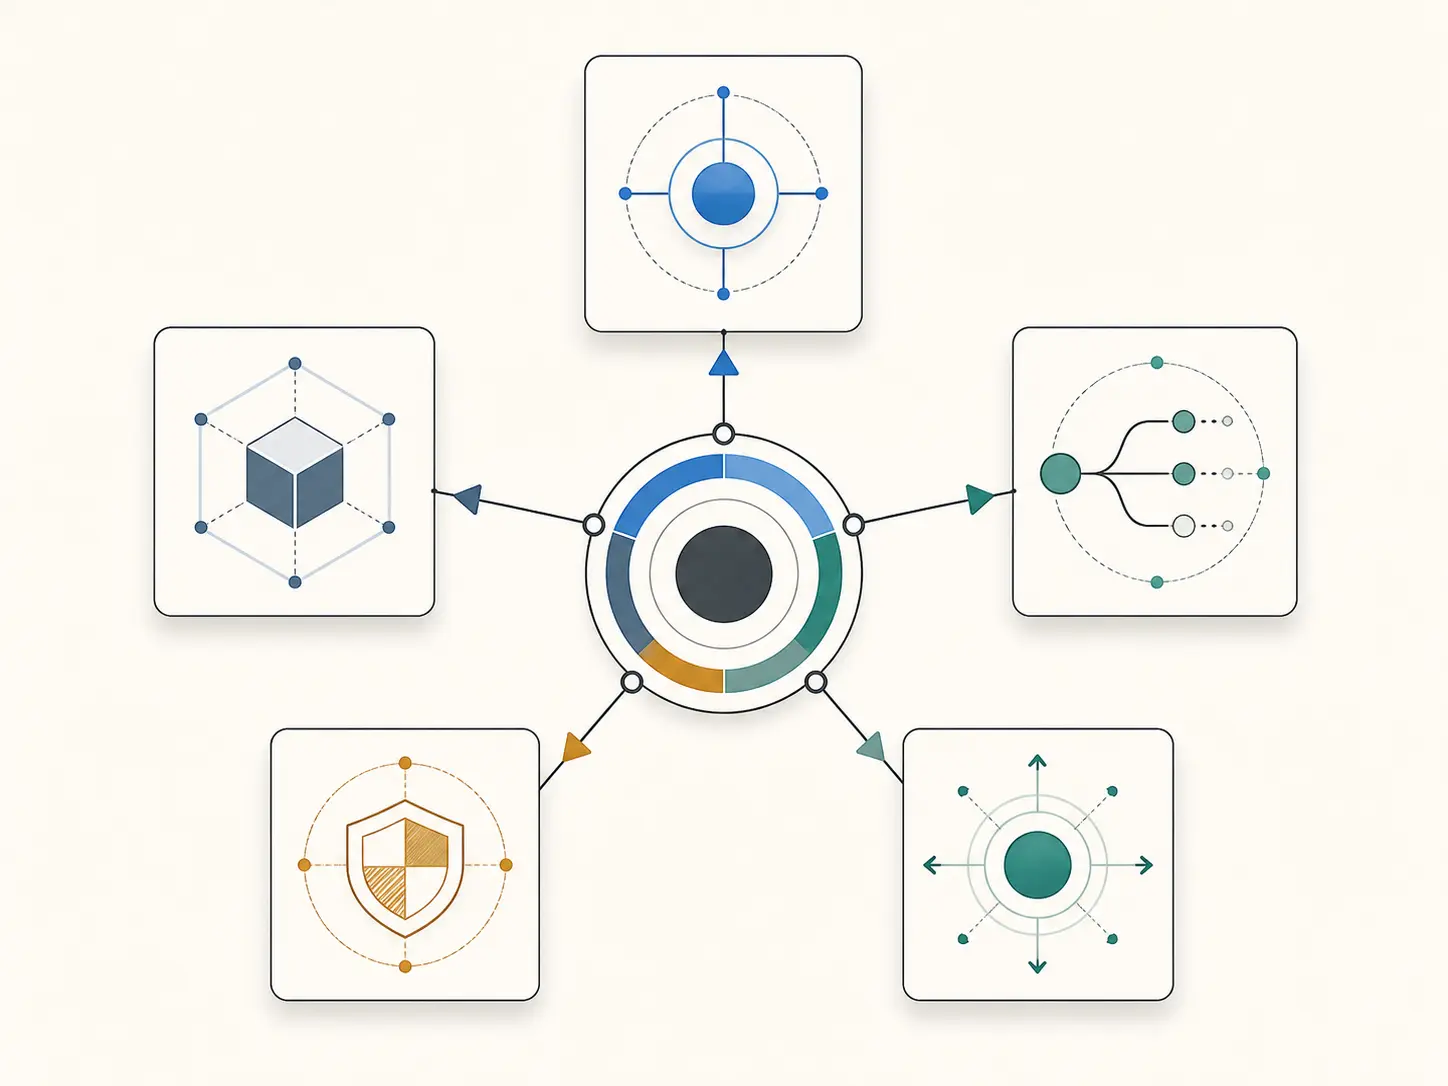
The names are compatible with current first-party guidance. OpenAI's Agents SDK, for example, groups a run into traces and records spans for generations, function tools, guardrails, and handoffs; its usage interface exposes request and token totals per run (OpenAI tracing, OpenAI usage tracking). You can implement the same shape with another runtime.
A copyable run-record contract
This is a deliberately minimal TypeScript-style artifact. It describes the fields; it does not prescribe a vendor, database, or dashboard.
type RunStatus =
  | 'succeeded'
  | 'partial'
  | 'failed'
  | 'blocked'
  | 'escalated'
  | 'timed_out';

type ActionKind =
  | 'model'
  | 'tool'
  | 'handoff'
  | 'approval'
  | 'guardrail'
  | 'human';

interface AgentRunRecord {
  task: {
    runId: string;
    traceId: string;
    goal: string;
    requestId: string;
    subjectBoundary: string;
  };
  runtime: {
    agentVersion: string;
    model: string;
    promptVersion: string;
    toolsetVersion: string;
    environment: string;
  };
  actions: Array<{
    sequence: number;
    kind: ActionKind;
    name: string;
    startedAt: string;
    endedAt: string;
    result: 'success' | 'error' | 'denied' | 'skipped';
    approvalId?: string;
    errorType?: string;
  }>;
  constraints: {
    latencyMs: number;
    retryCount: number;
    inputTokens?: number;
    outputTokens?: number;
    timeoutReached: boolean;
    policyViolations: string[];
  };
  effect: {
    status: RunStatus;
    verified: boolean;
    stateReference?: string;
    escalationReason?: string;
    incidentId?: string;
    evaluationCaseId?: string;
  };
}
The goal and stateReference fields need special care. They should identify the work and the source of truth without copying an entire customer record into your telemetry system. The contract is an interface to design against, not permission to capture every prompt, completion, or tool payload.
How do you build a trace that explains the run?
Create one top-level trace per meaningful unit of work, then nest spans beneath it. A practical shape is:
agent_run
├── model_turn
├── tool_call
│   └── tool_result
├── approval_or_policy_check
├── handoff
└── verified_effect
The tree should preserve order, parent-child relationships, timestamps, status, and a stable run identifier. It should also connect ordinary application logs to the same context. OpenTelemetry's logging guidance describes using TraceId and SpanId to correlate logs with traces and using shared resource context to correlate telemetry from different components (OpenTelemetry log correlation).
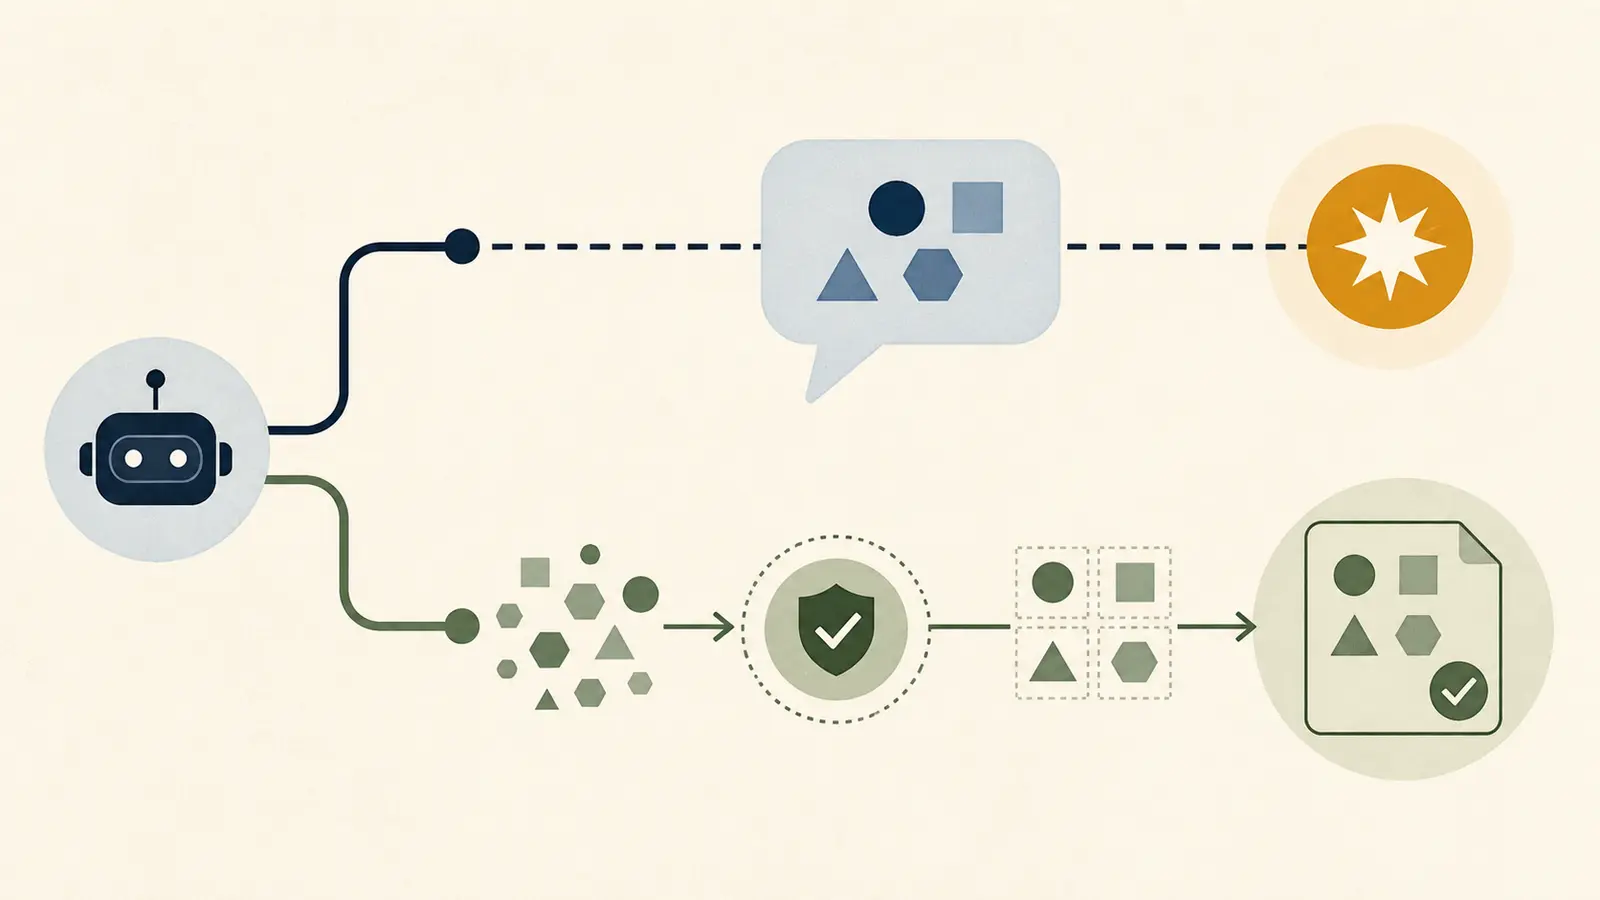
If the agent uses a framework with built-in tracing, start there and map its events into your contract. OpenAI's SDK documentation says its built-in tracing can be used to visualize, debug, and monitor workflows, with trace and span objects representing the overall workflow and its individual operations (OpenAI Agents SDK). If you own the loop, create the same boundaries yourself.
Record observable behavior: the declared goal, the tool selected, the arguments after validation, the result, the policy decision, the retry, and the state change. You do not need to store a model's private chain of thought to diagnose whether it called the wrong tool or exceeded its authority. In fact, “capture everything” is a poor default for a system that may process private documents.
Which metrics matter for an AI agent?
Organize metrics by the decision they support. A dashboard with twenty numbers is not useful if none of them tells an operator what to do.
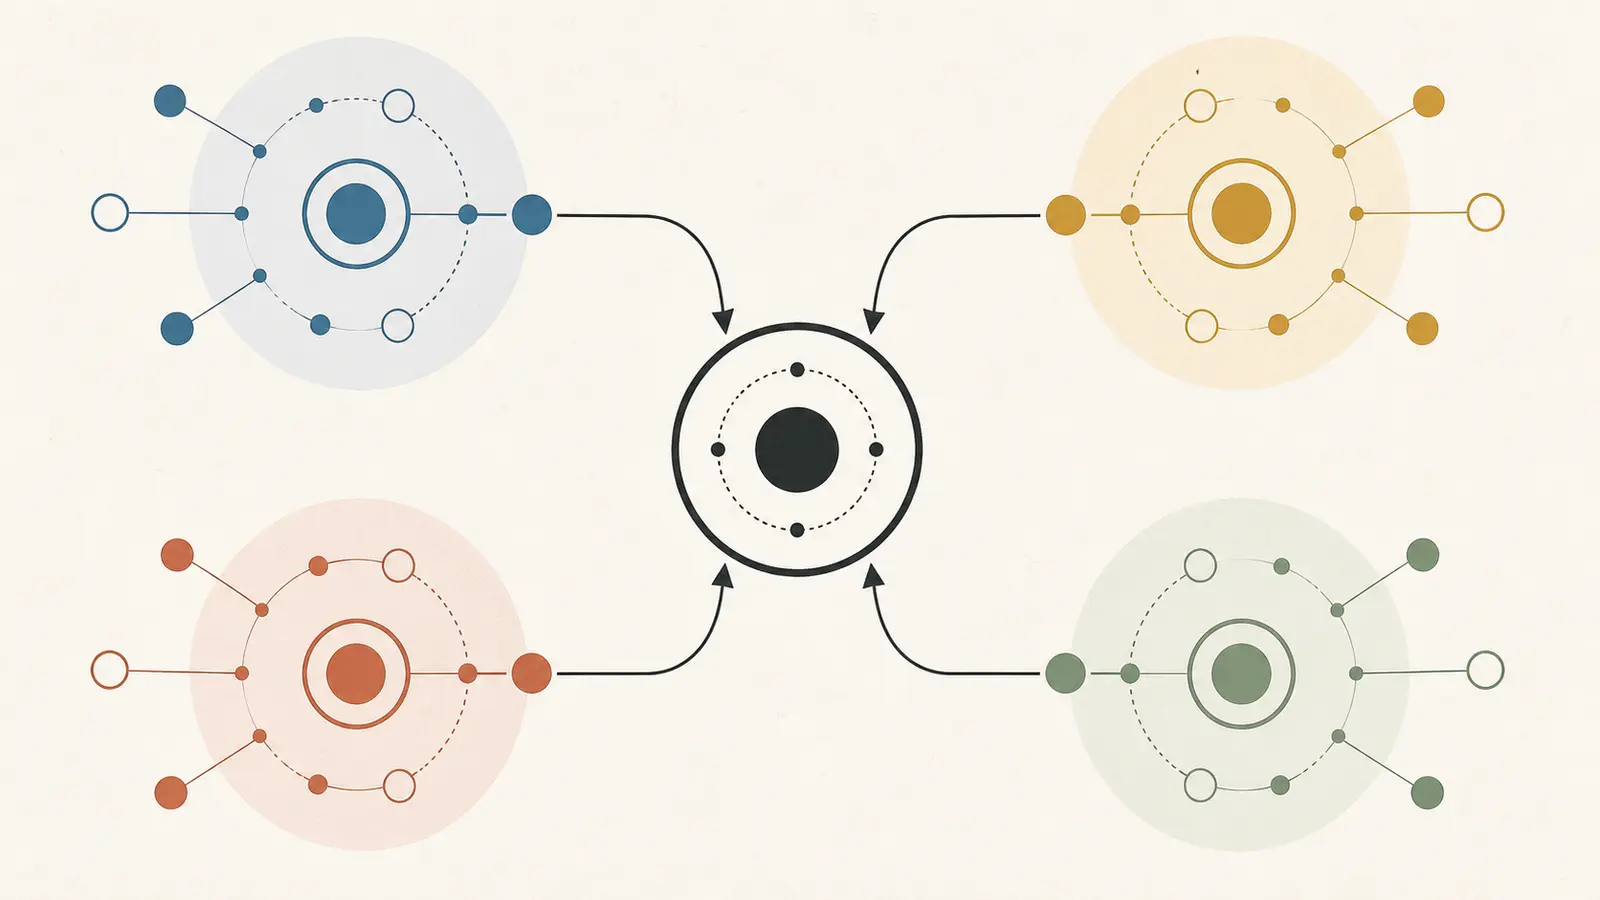
Outcome metrics: did the task work?
Track verified success, partial completion, failure, timeout, block, and escalation. Use a source of truth wherever one exists: a database state, file checksum, test result, ticket status, or explicit human decision. If the product is a response rather than a state change, define a bounded quality check and record whether a person or evaluator confirmed it.
Separate claimed success from verified success. The first is what the agent said. The second is what the environment shows. The gap between them is often the first useful reliability signal.
Behavior metrics: what did the agent do?
Count model turns, tool calls by name, handoffs, approvals, denials, tool errors, retries, and repeated equivalent actions. Track actions that were blocked as carefully as actions that ran. A rising denial rate may mean a prompt or permission change; a rising retry count may mean a dependency failure or an agent loop.
OWASP's 2026 agentic-application guidance recommends continuous monitoring of agent activity and a behavioral baseline that includes goal state, tool-use patterns, and invariant properties such as access patterns. That supports a useful rule: alert on a broken invariant even when the final response looks successful (OWASP Top 10 for Agentic Applications).
Constraint metrics: did the run stay inside its budget?
Record duration, time to first response when relevant, total model requests, input and output tokens, retries, tool latency, and timeout status. The OpenAI Agents SDK exposes request and token usage per run, but provider adapters differ, so validate the exact usage fields in the runtime you operate (OpenAI usage).
Do not copy a latency or cost threshold from somebody else's agent. Set a threshold from your workflow's user promise, dependency limits, and risk tolerance. The metric is useful when it triggers a decision: stop the run, route to a fallback, page an owner, or open an investigation.
Safety and governance metrics: did authority hold?
Record policy denials, permission mismatches, sensitive-data detections, approval requests, approval expirations, execution mismatches, unexpected tool paths, and changes to the declared goal. For consequential actions, the approval record should identify the exact action that was approved; the monitor should be able to detect if execution drifted from it. The detailed design of that boundary belongs in the human-in-the-loop guide.
NIST's monitoring guidance treats production behavior, safety, security, privacy, and incident response as ongoing concerns rather than a one-time launch check. That is why a “green” outcome metric cannot cancel a policy violation. A run that achieved the right state through an unauthorized path is not a successful run.
How do you monitor an agent without leaking sensitive data?
Treat telemetry as a second data system with its own access, retention, and deletion rules. OpenTelemetry warns that system instructions, messages, and tool definitions can contain sensitive information. OWASP likewise recommends structured logging, traceability, session scoping, and least-privilege access to logs (OpenTelemetry agent conventions, OWASP Securing Agentic Applications).
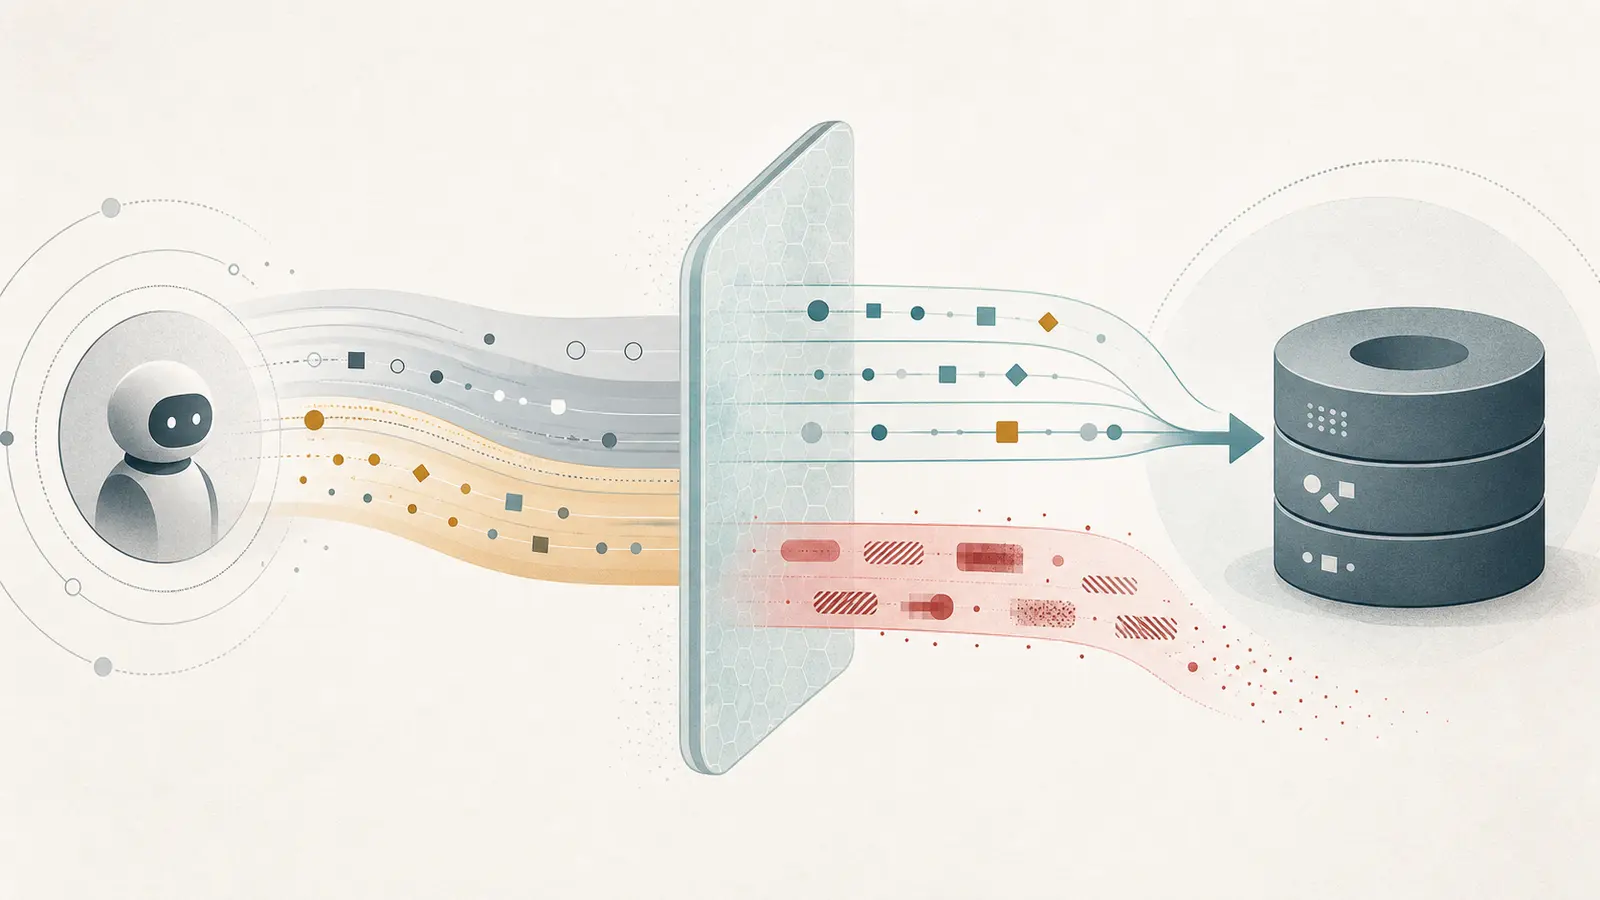
Use this order when deciding what to capture:
- Capture identifiers first. Keep run, trace, tenant, tool, version, and state references so an operator can navigate the incident.
- Capture structure before content. Store tool names, schemas, status, timings, counts, and error classes before storing raw arguments or messages.
- Redact at the boundary. Remove secrets, tokens, unnecessary personal data, and confidential payloads before export, not only in the dashboard.
- Make content capture explicit. If raw prompts, outputs, or tool results are needed for a controlled investigation, define who can see them, how long they remain, and how they are deleted.
- Test the redaction path. A redaction rule that works for a JSON field may fail when the same value appears in a nested tool result or error string.
OpenAI's Agents SDK documentation is a useful warning about defaults: it says generation and function spans may contain sensitive inputs and outputs, and documents trace_include_sensitive_data as a control for disabling that capture (OpenAI tracing and sensitive data). The exact setting will differ in another stack, but the design question is universal: what evidence is necessary to operate the system, and what evidence creates more risk than value?
What should trigger an alert?
Use a three-level policy. The exact thresholds belong to the workflow owner.
| Signal | Block or page immediately | Investigate soon | Trend over time |
|---|---|---|---|
| Authority | Unapproved high-impact tool call, approval/action mismatch, unexpected privilege | Repeated policy denials or near-miss paths | Denial rate by tool, user group, or version |
| Reliability | Missing trace, unverifiable effect, unsafe state change | Timeout, dependency error, repeated retry, escalation | Verified success and partial-completion rate |
| Limits | Hard budget, time, or retry limit reached | Unusual tool latency or token use | Cost and duration by workflow and version |
| Drift | Goal changed outside policy or a known invariant failed | Outcome distribution moves away from baseline | Performance by model, prompt, toolset, and environment |
| Privacy | Redaction failure or unauthorized telemetry access | Unexpected content capture | Volume of sensitive-field suppression and access reviews |
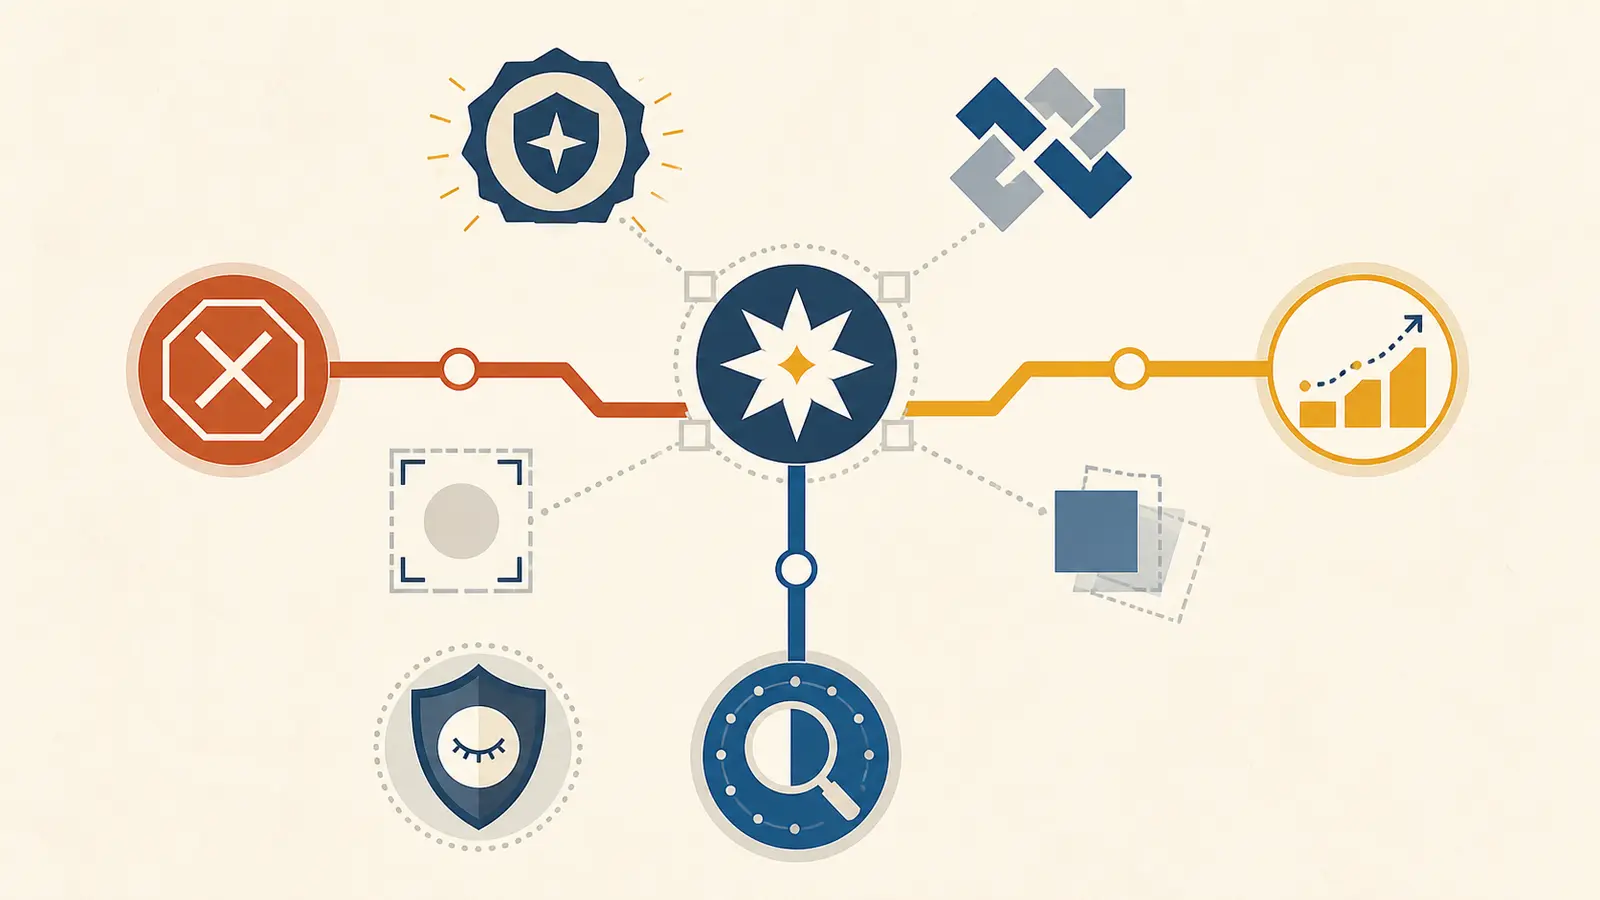
NIST's 2026 report on deployed AI monitoring identifies fragmented logging, performance degradation, and uncertainty about monitoring cadence as open operational problems. That is a reason to keep the first alert set small and tied to actions, not a reason to build a wall of dashboards (NIST, Challenges to the Monitoring of Deployed AI Systems).
The best first alerts are often invariants:
- every run has a trace ID;
- every tool call belongs to an allowed toolset;
- every consequential action has a valid decision record;
- every claimed state change has a verification step;
- every run stops at its retry, time, or budget limit;
- every production failure has an owner and a disposition.
These checks are easier to explain than a single “agent quality” score. They also fail in ways a person can repair.
How do you turn a production failure into improvement?
Monitoring is only useful if it changes the system. Use this five-step loop:
- Reconstruct. Open the trace and correlate application logs, tool results, approvals, and the verified effect.
- Classify. Label the failure: wrong goal, bad retrieval, wrong tool, invalid arguments, permission failure, dependency failure, loop, limit breach, or unverifiable outcome.
- Contain. Reduce scope, disable a tool, add approval, switch to a fallback, or pause the workflow while the owner investigates.
- Promote. Turn the confirmed failure into a durable evaluation case with the expected effect and forbidden actions. Keep it in the suite even after the prompt changes.
- Compare. Run the candidate against the old case and the existing baseline. Record whether the repair fixed the failure without creating a new authority, privacy, or cost problem.
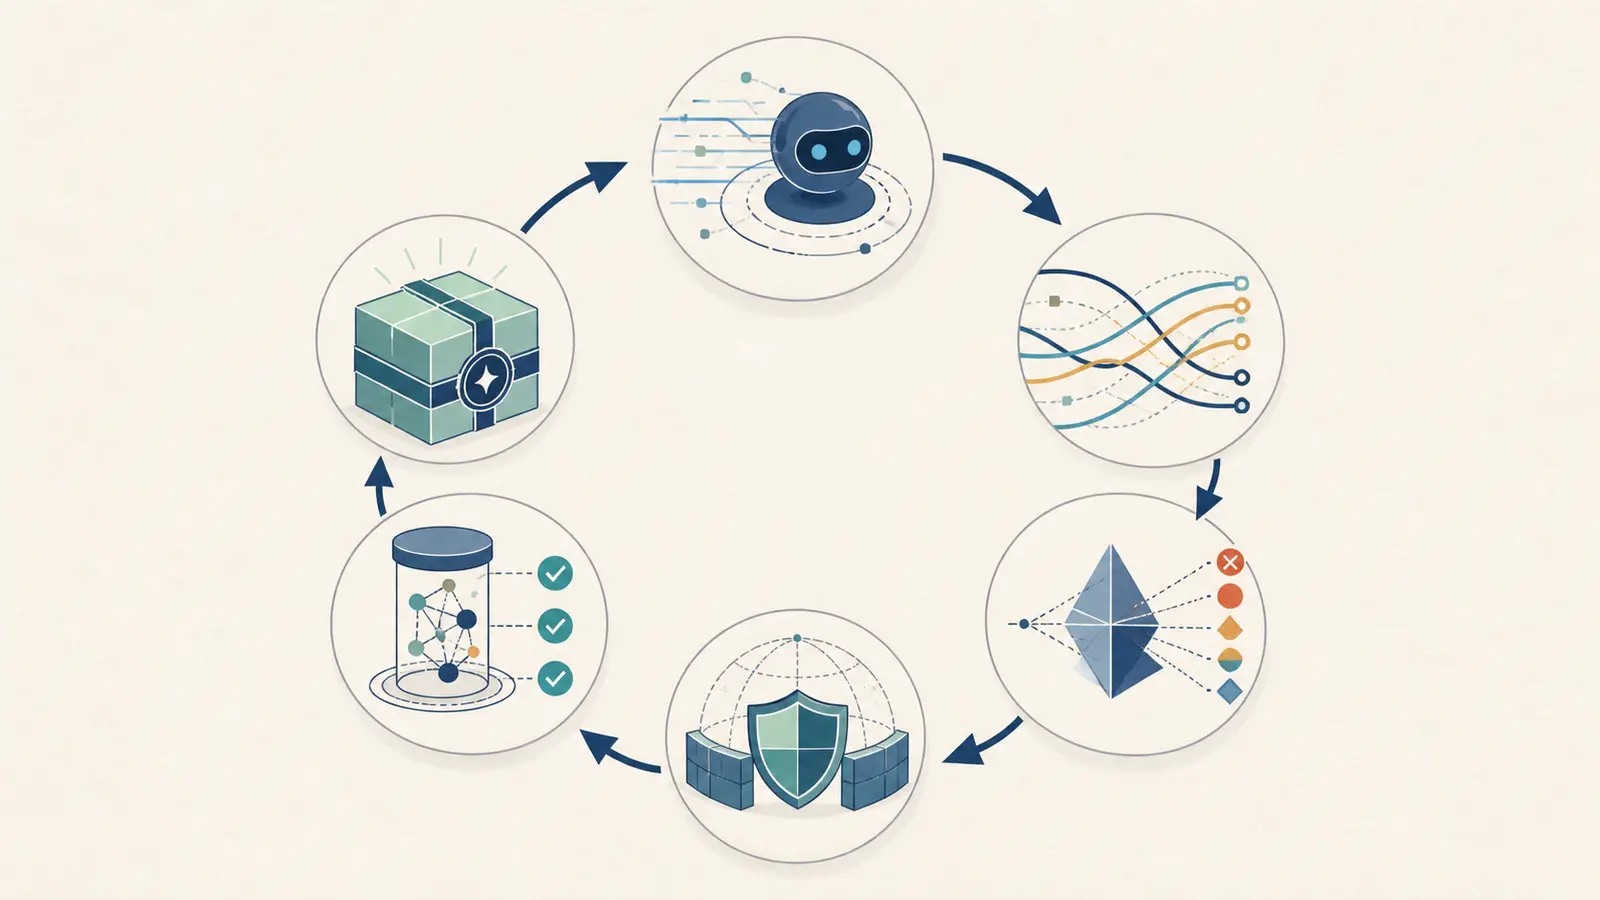
This is where monitoring and evaluation meet. Production traces provide the cases reality actually produced; offline evaluation provides a safer place to test a change. Neither replaces the other. NIST recommends regular measurement and monitoring because deployed context changes, and its monitoring work highlights drift and fragmented evidence as practical barriers. The repair loop is a response to those conditions, not a claim that it eliminates them.
A practical first week
If you have no agent monitoring today, do not begin by comparing observability platforms. Instrument one workflow deeply enough to answer the five TRACE questions.
- Choose one agent run that has a verifiable outcome and an owner.
- Add a top-level run ID and propagate its trace context into model, tool, and application events.
- Record versions, actions, limits, policy decisions, and the verified effect.
- Redact content and restrict access before exporting traces outside the application boundary.
- Add three alerts: missing evidence, authority failure, and a hard operating limit.
- Review the first failures with the person who owns the workflow, then add one confirmed failure to the evaluation suite.
If the workflow has no clear source of truth, stop at assistive scope until you can define what success means. If it has no owner, assign one before adding autonomy. If the task does not need flexible multi-step judgment, return to the decision framework for when to use an AI agent; more telemetry cannot justify an unnecessary architecture.
For teams that want to map this contract onto a real workflow, my one-to-one AI consulting is for working through the system you actually operate: its tools, permissions, failure cases, and evidence. The article is complete without that step. The useful next move is to pick one run and see whether you can prove what it changed.